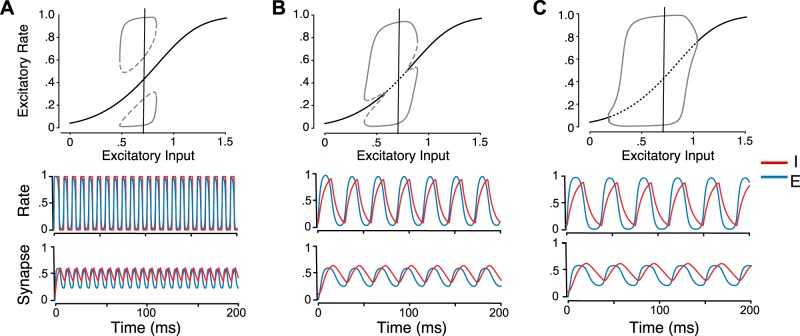
Fig. A1.
Oscillation and bifurcation properties of the rate and synapse model with parameters modified from those used in Fig. 2. A: oscillatory solutions exist and appear as an isola, where a stable oscillatory state exists over a range of input values and coexists with a stable steady state over the entire range. B: bistability arises here through subcritical Hopf bifurcations. C: oscillations emerge via supercritical Hopf bifurcations. Gray dotted lines correspond to unstable oscillation amplitudes, solid gray lines to stable oscillation amplitudes, solid black lines to stable steady state, and dotted black lines to unstable steady state. Rate and synaptic time courses for each of the models are shown at bottom. These time courses reflect an input current, IE of 0.7, to the excitatory population, indicated by the vertical lines in the bifurcation plots. Parameter values for the 3 cases are A: = 1, = 8, = = 0.1, B: = 3, = 8, = 2, = 6, and C: = 3, = 10, = 2, = 8. All other values are the same for the rate and synapse as for Fig. 2 except for the following: γE = 1 and γI = 2, wEE = 5.

