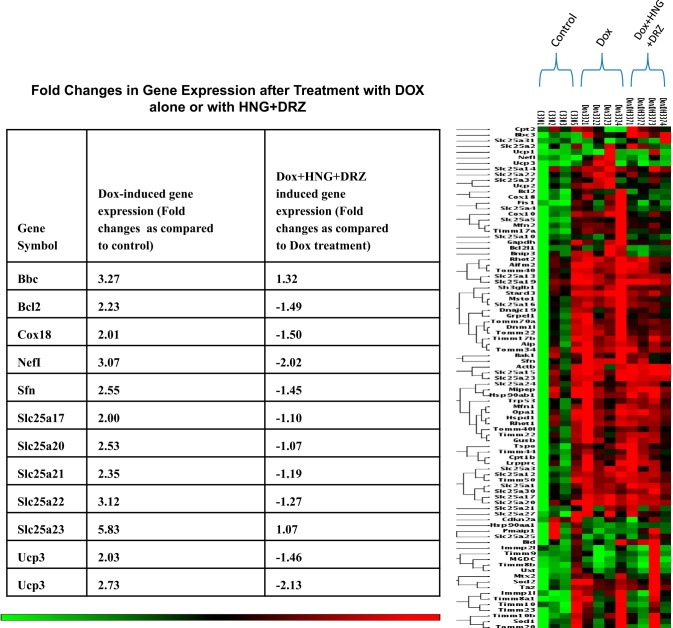
Fig. 6.
Heat map indicating coregulated genes across groups of control, doxorubicin (Dox) alone-, and Dox + synthetic humanin analog (HNG) + dexrazoxane (DRZ)-treated mice. Red or near-red color indicates upregulation; green or near-green color indicates downregulation. In the table, positive number indicates upregulation and negative number indicates downregulation.

