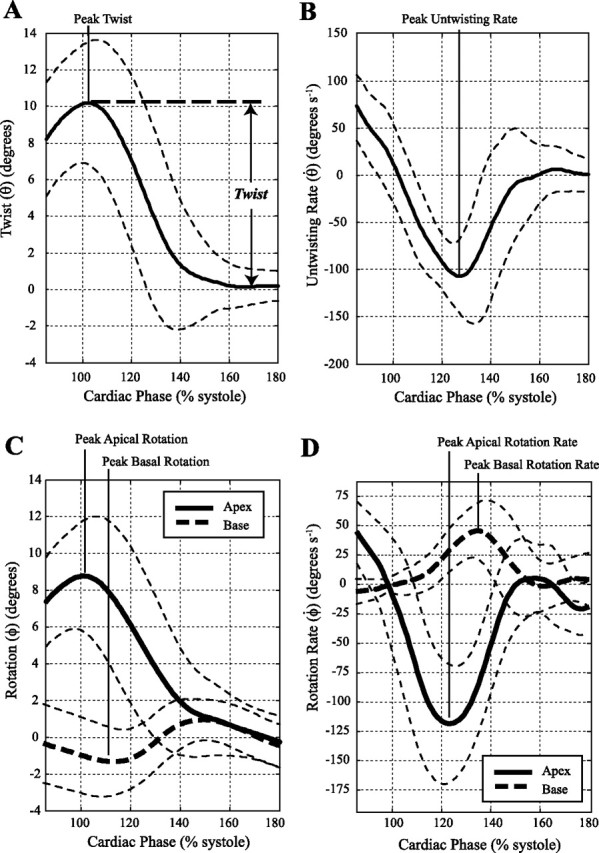
Fig. 2.

Average twist (A), untwisting rate (B), and apical and basal rotation (C) and rotation rate curves (D) for the 32 subjects. The thin dashed lines show a range of ±1SD. As shown in A, twist is defined relative to the equilibrium values during diastasis before atrial contraction.
