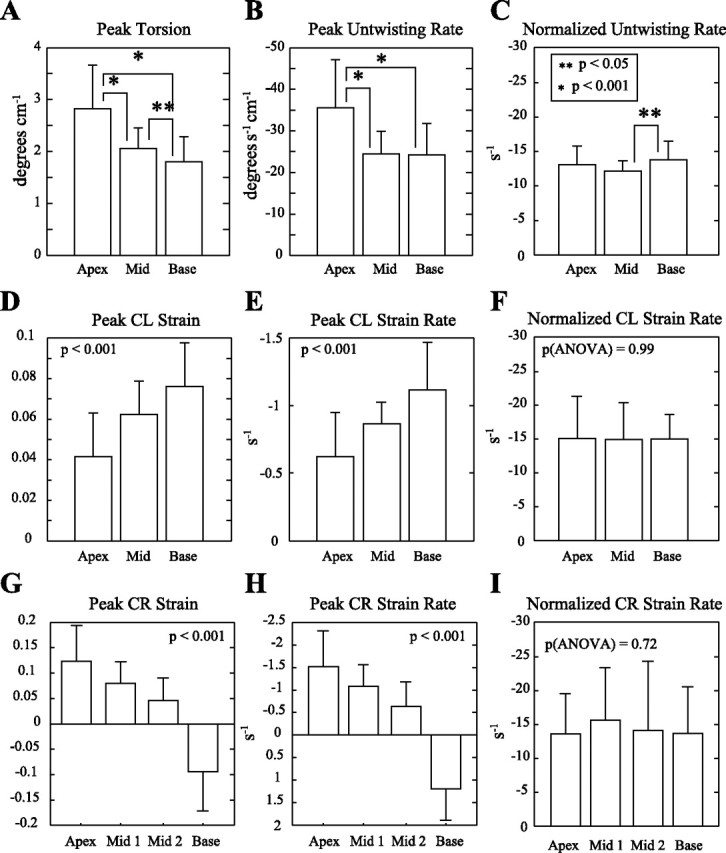
Fig. 5.

A, D, and G: peak torsion, ϵCL, and ϵCR values in the 32 subjects, measured from apex to base. B, E, and H: the early diastolic peak rates of change for the strain components shown in A, D, and G, showing similar patterns as a function of position. C, F, and I: normalization of the diastolic rates (B, E, and H) to the peak systolic strain (A, D, and G) for each component yields a performance metric that is termed the untwisting performance or strain rate performance (with units in s−1).
