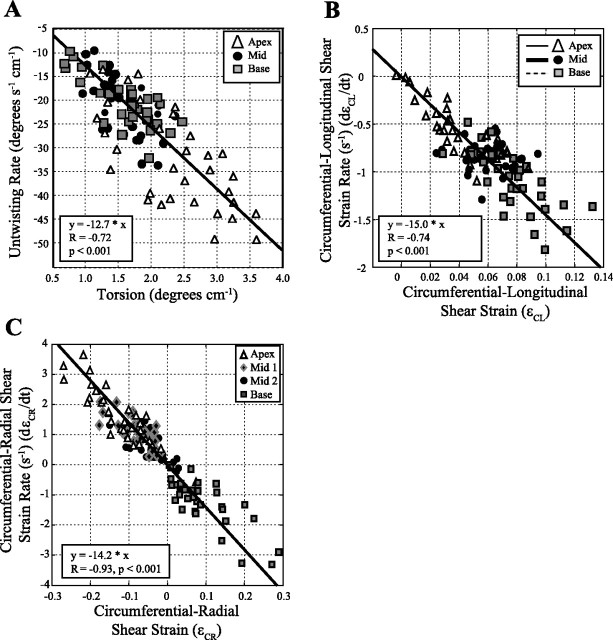
Fig. 6.
Torsion and shear strain values are compared with strain rates in all 32 subjects. Mean values are summarized in Fig. 5. A: peak torsion (in twist/cm) at apical, mid, and basal locations are compared with the corresponding untwisting rates. B: the circumferential-longitudinal (ϵCL) shear strains and strain rates are significantly different at apex, mid, and base locations, and all regions show a similar negative correlation between strain and strain rates. C: the circumferential-radial (ϵCR) shear strains vary from negative values at the apex to positive values at the base with a significant negative correlation with the corresponding diastolic shear strain rates.

