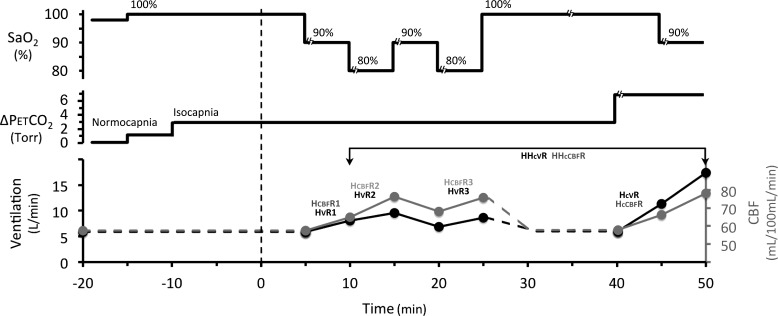
Fig. 1.
Time course of step changes in O2 saturation (; top) and (middle) for hypoxic and hypercapnic responses; bottom: time courses of ventilation and CBF responses. The paradigm is described in detail in Sato et al. (50). The initial 5 min is poikilocapnic ventilation while subjects acclimatize to the breathing apparatus. The rebreathing circuit is then connected, and after a further 5 min of hyperoxia, a small increase in (~3 Torr) is introduced to achieve isocapnic ventilation. The response measurements start once steady-state ventilation (or steady-state CBF) is achieved (indicated as 0 time on the timeline). The changes following step changes define the hypoxic response. Subjects are then again returned to hyperoxia, and after a 10-min period to remove any residual hypoxic drive, the hypercapnic and combined hypoxic hypercapnic responses are measured.

