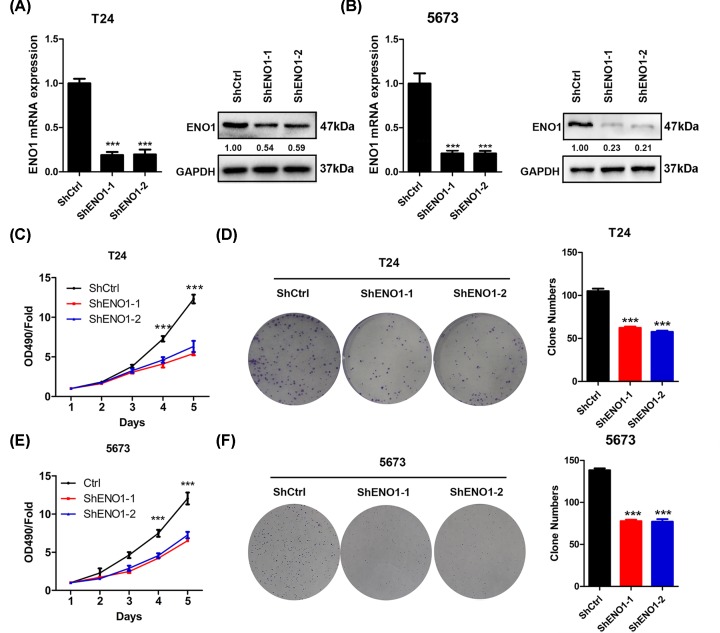
Figure 2. ENO1 knockdown inhibits the proliferation and colony formation of bladder cancer cells.
(A) T24 cells were infected with shCtrl, shENO1-1 and shENO1-2 lentivirus for three times and then were subjected to qRT-PCR and Western blot analysis of ENO1. ***P<0.001. (B) 5637 cells were infected with shCtrl, shENO1-1 and shENO1-2 lentivirus for three times and then were subjected to qRT-PCR and Western blot analysis of ENO1. ***P<0.001. (C) shCtrl, shENO1-1 and shENO1-2 T24 cells were subjected to CCK analysis of proliferation. ***P<0.001. (D) Cells described in (C) were subjected to colony formation analysis. Left, representative images. Right, quantification results. ***P<0.001. (E) shCtrl, shENO1-1 and shENO1-2 5637 cells were subjected to CCK analysis. ***P<0.001. (F) Cells described in (E) were subjected to colony formation analysis. Left, representative images. Right, quantification results. ***P<0.001.

