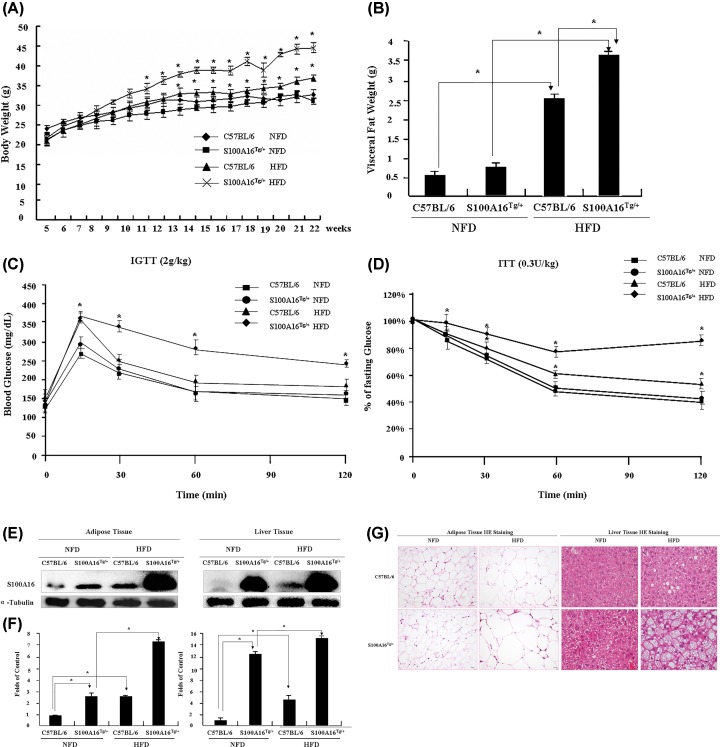
Figure 1. Effects of S100A16 on fat metabolism and insulin resistance.
C57BL/6 and S100A16Tg/+ male mice were fed a NFD or HFD from 5 to 21 weeks of age (n = 6 for C57BL/6 NFD mice, n = 5 for S100A16Tg/+ NFD mice, n = 14 for C57BL/6 HFD mice, n = 8 for S100A16Tg/+ HFD mice). (A) Body weight monitored every week. (B) Visceral fat weight measured following administration of the anesthetic Nembutal (100 mg/kg). (C) At 14 and 20 weeks, intraperitoneal glucose tolerance tests (IGTT) were performed twice. All mice were starved overnight, then injected intraperitoneally with glucose at a dose of 2 g/kg of body weight, and blood glucose levels were monitored using a handheld glucometer at 15, 30, 60, and 120 min. (D) The response in blood glucose following an intraperitoneal injection of insulin (0.3 unit/kg of body weight). At 15 and 21 weeks, insulin tolerance tests (ITT) were performed twice. All mice were starved for 12 h, then injected with a bolus of insulin (0.3 unit/kg of body weight), and blood glucose levels were monitored using the handheld glucometer at 15, 30, 60, and 120 min, and blood glucose concentrations at different time points were expressed as a percentage of the fasting blood glucose concentrations. (E) At the end of the study, adipose and liver tissues were removed immediately, and S100A16 protein levels were determined by a Western blotting with an S100A16-specific antibody. (F) Relative expression of S100A16 based on grayscale analysis with α-tubulin as a control. (G) Images of visceral fat cells and liver cells. Adipose and liver tissues were removed, immediately fixed with formalin and embedded in paraffin, and subjected to hematoxylin and eosin (HE) staining (bar = 20 μm).

