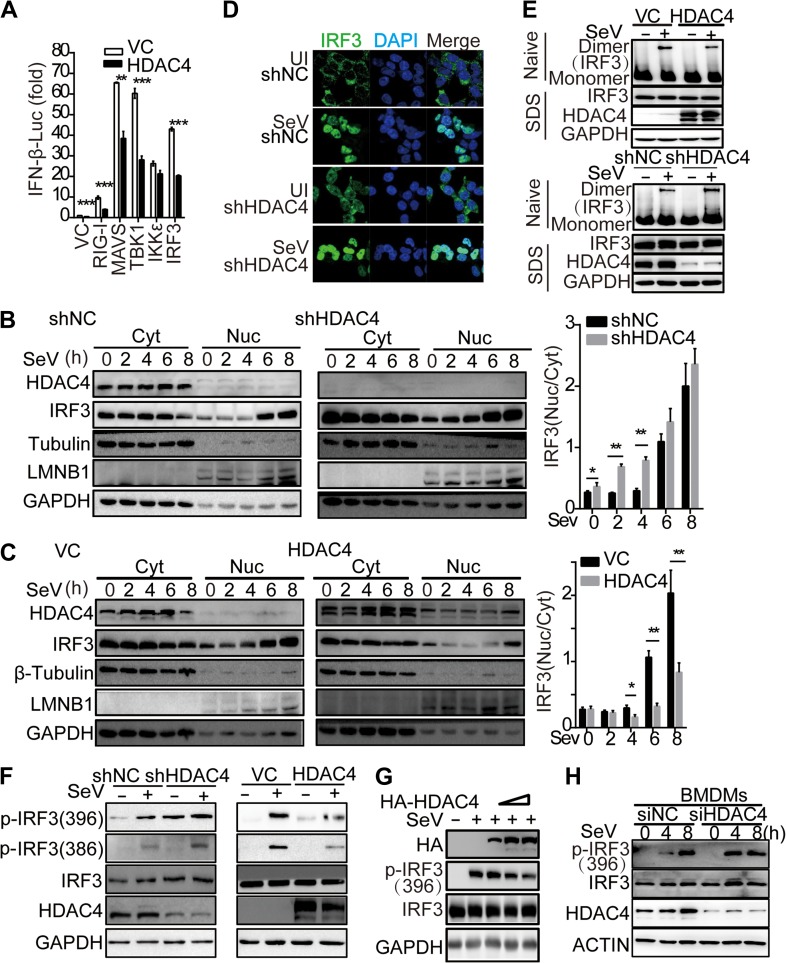
Figure 3.
HDAC4 alleviated the import of IRF3 into the nucleus. (A) Luciferase assay analysis of IFNB1 promoter activity in HEK293T cells cotransfected with empty vector or HDAC4 plasmid and the cDNA encoding Flag-tagged RIG-I, MAVS, TBK1, IKKε, or IRF3 plasmid. (B) IB analysis of shNC or shHDAC4 HEK293T cell lines infected with SeV, followed by nucleus–cytoplasm extraction (5% of cytoplasmic extracts and 10% of nuclear extracts separated by SDS-PAGE). Histogram statistics show the nuclear–cytoplasmic ratio of IRF3 band intensity, normalized to that of Lamin B or β-tubulin. (C) IB analysis of HEK293T cells transfected for 36 h with control vector or HDAC4 plasmid and infected with SeV for the indicated times, followed by nucleus–cytoplasm extraction as in B. Histogram statistics are carried out as in B. (D) Confocal microscopy of shNC or shHDAC4 HEK293T cell lines uninfected (first and third rows) or infected for 8 h with SeV (second and fourth rows), probed with the DNA-binding dye DAPI (blue) and anti-IRF3 (green). Scale bar, 10 μm. (E) IB analysis of IRF3 in dimer or monomer form (upper) or total IRF3, HDAC4, and GAPDH (lower) in HEK293T cells transfected for 48 h with empty vector or cDNA encoding HDAC4 or in shNC and shHDAC4 HEK293T cells left uninfected or infected for 8 h with SeV, followed by native PAGE (top) or SDS-PAGE (bottom). (F and G) IB analysis of IRF3 phosphorylation at Ser386 and Ser396, respectively, total IRF3, GAPDH, and HDAC4 or HDAC4(HA) in shNC or shHDAC4 HEK293T cell lines transfected for 36 h with control vector or HDAC4 plasmid and then uninfected or infected for another 8 h with SeV or transfected gradient concentrations of HDAC4. (H) IB analysis of IRF3 phosphorylated at Ser396, total IRF3, HDAC4, and β-actin (loading control) in the wild-type or knockdown of HDAC4 BMDMs infected for various times with SeV. The numbers under the WB lines mean the gray value corresponding to the lane. NS, not significant (P > 0.05), *P < 0.05, **P < 0.01, and ***P < 0.001 (unpaired t-test). Data are representative of three independent experiments with similar results (B−H) or from three independent experiments (A and histograms in B and C; mean ± SD).

