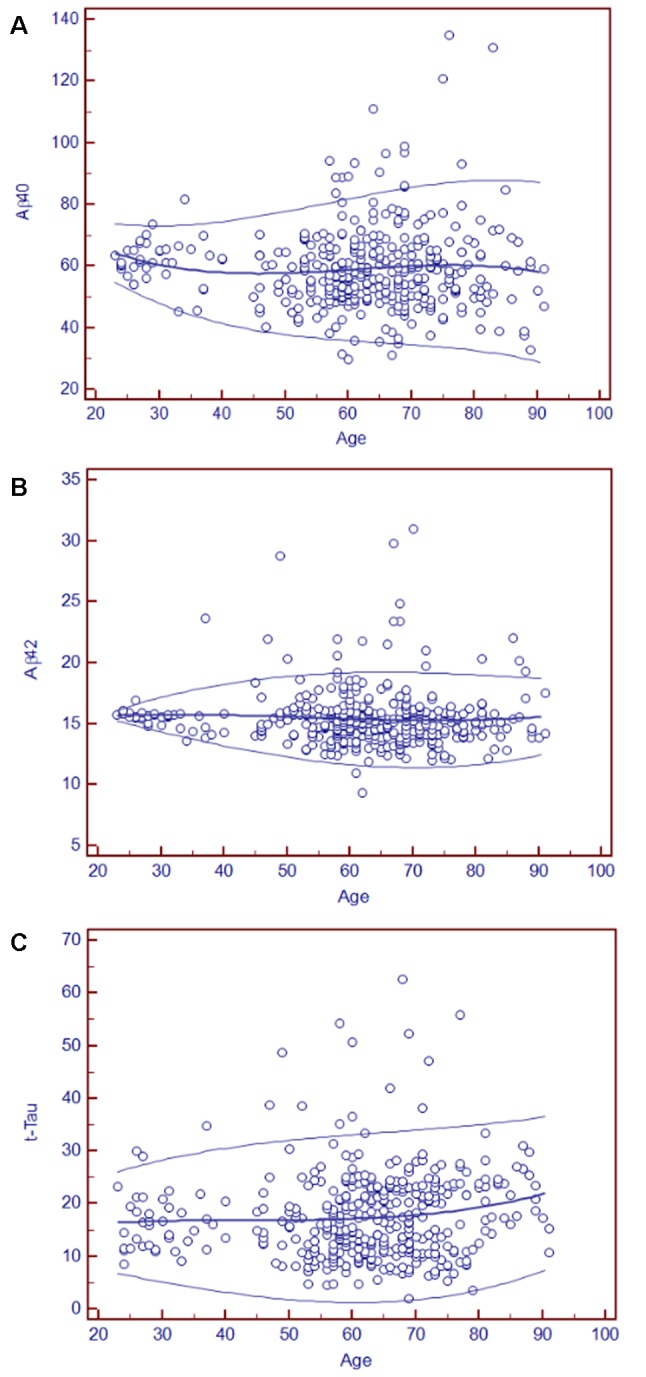
Figure 2.

Age-related plasma biomarker reference intervals: means and centiles. The scatter plots illustrate the reference intervals for Aβ40 (A), Aβ42 (B), and t-Tau (C). The age range in years is indicated on the x-axis, and the reference intervals of each marker are shown in circles in the figure. The units of the reference intervals are pg/ml. The central lines are the calculated means, and the top and bottom lines are the 90th and 10th centile curves.
