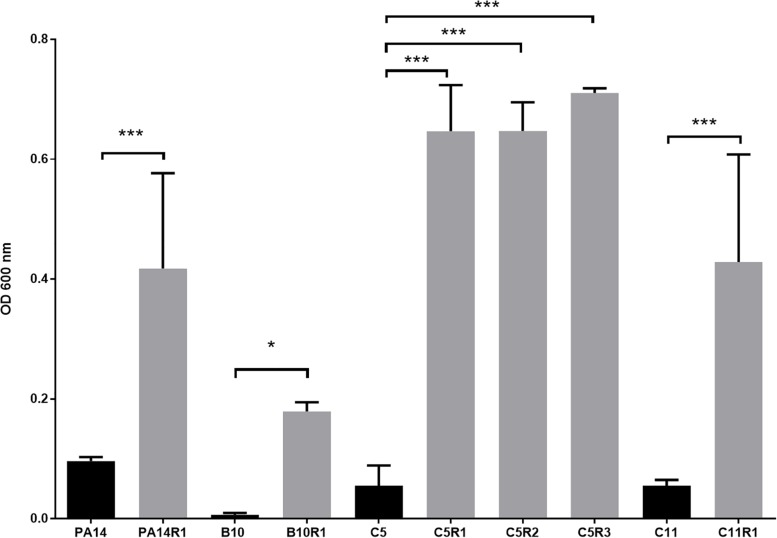
FIGURE 2.
Growth of phage resistant (gray) and the associated parental strains (black) in presence of phage cocktail. For each strain, bars represent the mean density (OD 600 nm) after 16 h of incubation in MOPS glutamate with phage cocktail. Error bars represent the standard deviations of three replicated experiments. ∗p-values < 0.05; ∗∗∗p-values < 0.001 according to Student’s t-test or ANOVA analysis.

