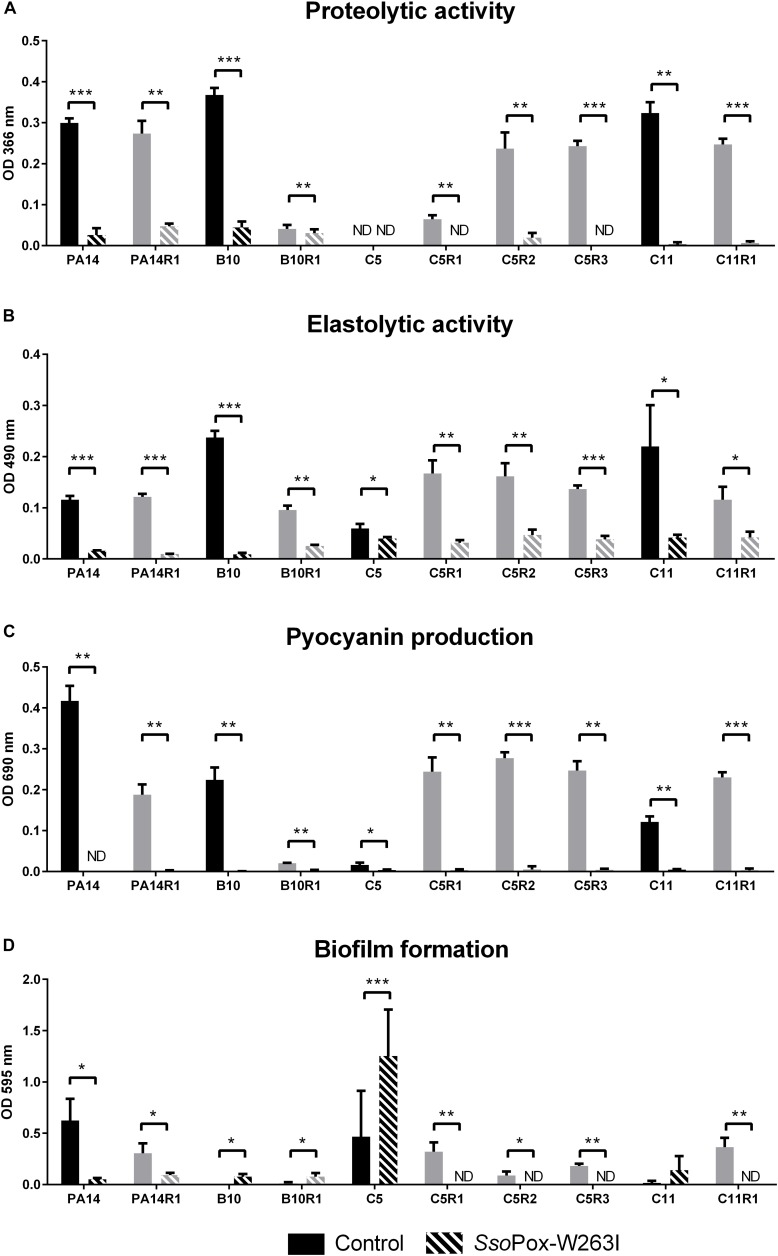
FIGURE 3.
Effect of SsoPox-W263I on virulence factors of phage resistant mutants (gray) and the associated parental strains (black) in vitro. For each strain, bars represent the mean of protease (A), elastase (B), pyocyanin (C) and biofilm (D) levels of three experiments for treated culture with 0.5 mg ml–1 SsoPox-W263I (striped bar) or inactive mutant 5A8 as negative control (empty bar). ND: not detected. Error bars represent the standard deviations of three experiments. ∗p-values < 0.05; ∗∗p-values < 0.01; ∗∗∗p-values < 0.001 according to Student’s t-test.

