
Figure 3.
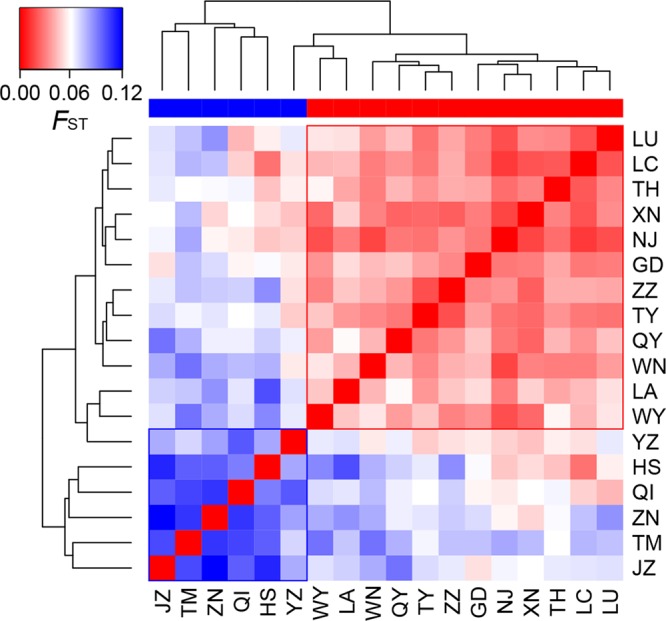
Heatmap of pairwise F ST values among the 18 populations of Quercus chenii. Blue and red bars indicate highland and lowland populations, respectively. Population codes are shown in Table 1 and Supplementary Table S1 .
Official websites use .gov
A
.gov website belongs to an official
government organization in the United States.
Secure .gov websites use HTTPS
A lock (
) or https:// means you've safely
connected to the .gov website. Share sensitive
information only on official, secure websites.
Heatmap of pairwise F ST values among the 18 populations of Quercus chenii. Blue and red bars indicate highland and lowland populations, respectively. Population codes are shown in Table 1 and Supplementary Table S1 .