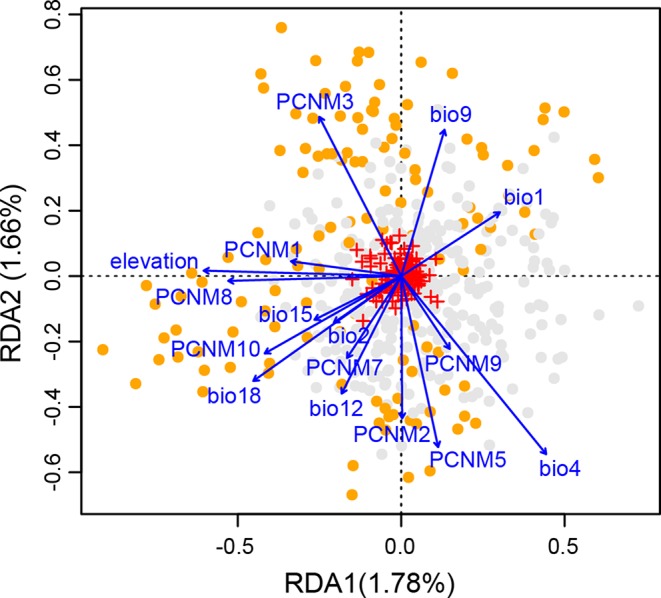
Figure 5.

Biplot from redundancy analysis (RDA) showing the association of genetic variation at the 14 nuclear microsatellite (nSSR) loci with geographic and climatic variables. Small red crosses at the center represent the 177 allelic variables. Eight eigenvectors corresponding to positive eigenvalues of the principal coordinates of neighbor matrix (PCNM) were used as geographic variables. Eight climatic variables include elevation, annual mean temperature (bio1), mean diurnal temperature range (bio2), temperature seasonality (bio4), mean temperature of driest quarter (bio9), annual precipitation (bio12), precipitation seasonality (bio15), and precipitation of warmest quarter (bio18). Orange and gray dots indicate individuals from highlands and lowlands, respectively. The proportion of total genetic variation explained by each axis is shown in parentheses.
