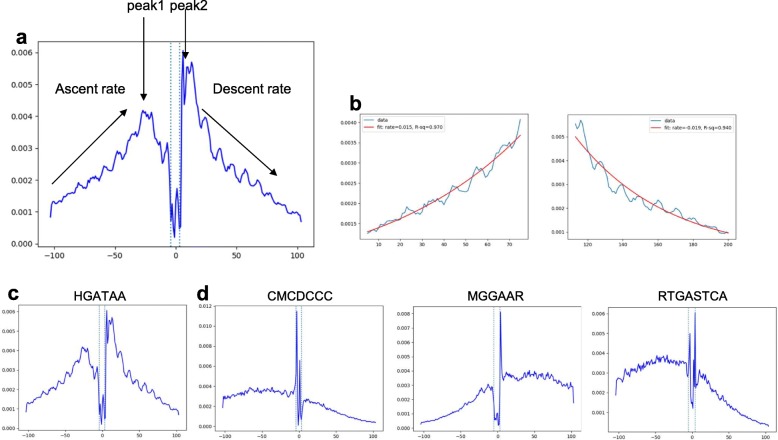
Fig. 3.
Footprint symmetry analysis reveals the primary and secondary motifs. a Symmetry analysis calculates the ascent and descent rates for the two sides of footprint via fitting an exponential decay curve to each part. b An example of exponential decay curve that is fit on real data. c A perfect symmetry indicates a primary motif (HGATAA). d A substantial difference between ascent and descent rates would indicate a motif footprint with an asymmetric footprint shape, as shown by CMCDCCC, MGGAAR, and RTGASTCA secondary motifs. Asymmetry is quantified by the footprint symmetry score (FSS)

