Fig. 1.

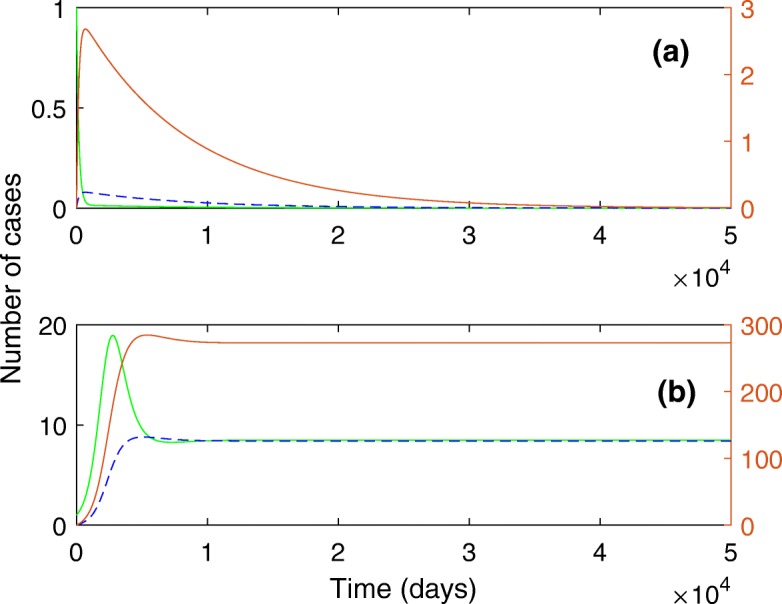
Below and above the epidemic threshold. The solution curves for I(t) (green line), C(t) (red line) and A(t) (dash line). a when α<αc. b when α>αc. The parameter values are described in the text

Below and above the epidemic threshold. The solution curves for I(t) (green line), C(t) (red line) and A(t) (dash line). a when α<αc. b when α>αc. The parameter values are described in the text