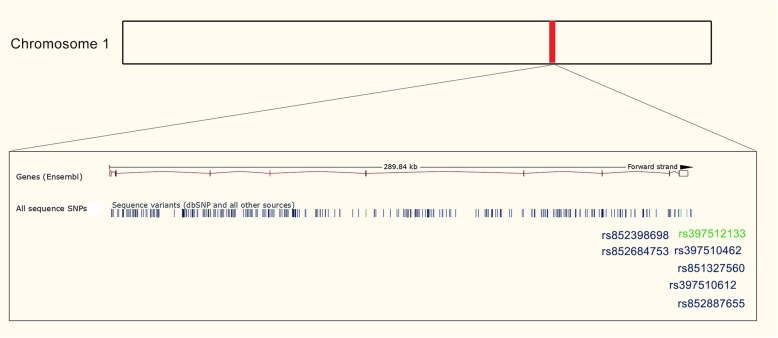
Fig. 2.
Schematic illustration of the selected SNPs of ESR1 gene located in the chromosome 1. The selected SNPs are represented on the illustration by their cluster ID numbers in the public SNP database. Coding regions are shown as a box on a horizontal bar whereas the horizontal bar represents the noncoding region of the illustrated fragment. Green: synonymous SNP; blue: intronic SNPs

