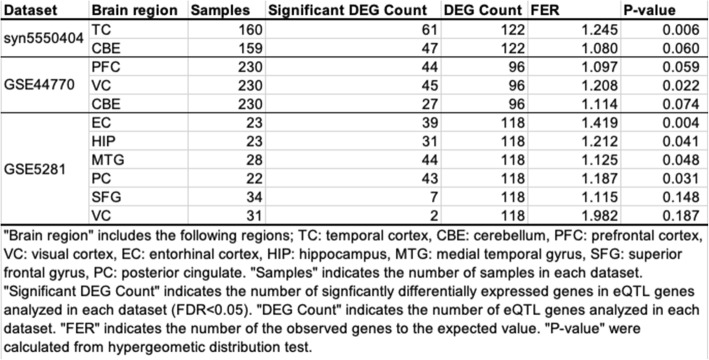
Table 2.
Statistical test for DEG enrichment in eQTL genes
“Brain region” includes the following regions; TC temporal cortex, CBE cerebellum, PFC prefrontal cortex, VC visual cortex, EC entorhinal cortex, HIP hippocampus, MTG medial temporal gyrus, SFG superior frontal gyrus, PC posterior cingulate. “Samples” indicates the number of samples in each dataset. “Significant DEG Count” indicates the number of significantly differentially expressed genes in eQTL genes dataset. “FER” indicates the number of the observed genes to the expected value. “P-value” were calculated from hypergeometic distribution test

