
Fig. 4.
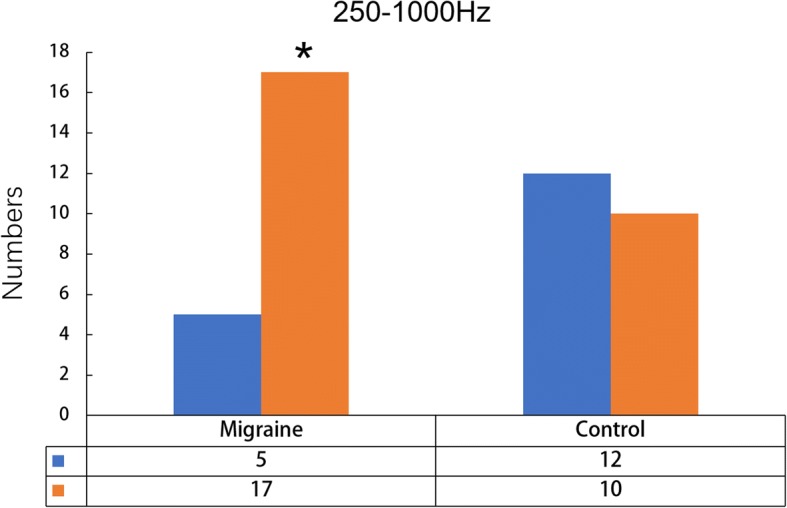
Number of migraineurs and controls with different functional connectivity patterns at 250–1000 Hz. Patients have significantly higher odds of functional connectivity in the frontal lobe than the controls. The orange bars indicate that functional connections are present in frontal cortices. The blues bars indicate that no excitatory connections exist in frontal cortices