Fig. 4.
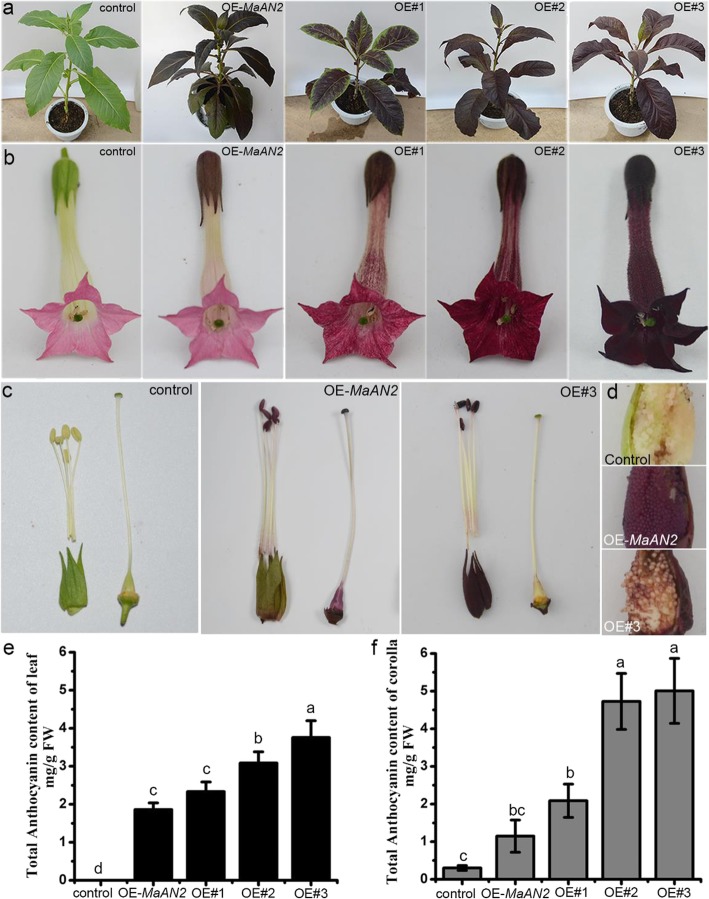
Phenotypic observation and total anthocyanin content of the leaves and corollas of the control, OE (overexpressing)-MaAN2, and three OE-MaMybA line (OE#1, OE#2, and OE#3) tobaccos. Phenotype of total plant (a), phenotype of flower (b), calyx, anthers, filament, and ovary of a flower (c), and seeds (d). A quantitative determination of the anthocyanin content of the leaves (e) and corollas (f) in the control, OE-MaAN2, and three OE-MaMybA line tobaccos. The anthocyanin extracts from the leaves and corollas were analyzed using high-performance liquid chromatography and were each monitored at 530 nm. A standard curve of cyanidin 3-rutinoside content was used as a control to calculate the anthocyanin content in the tobacco. Error bars indicate standard deviations (SD) in the average anthocyanin content

