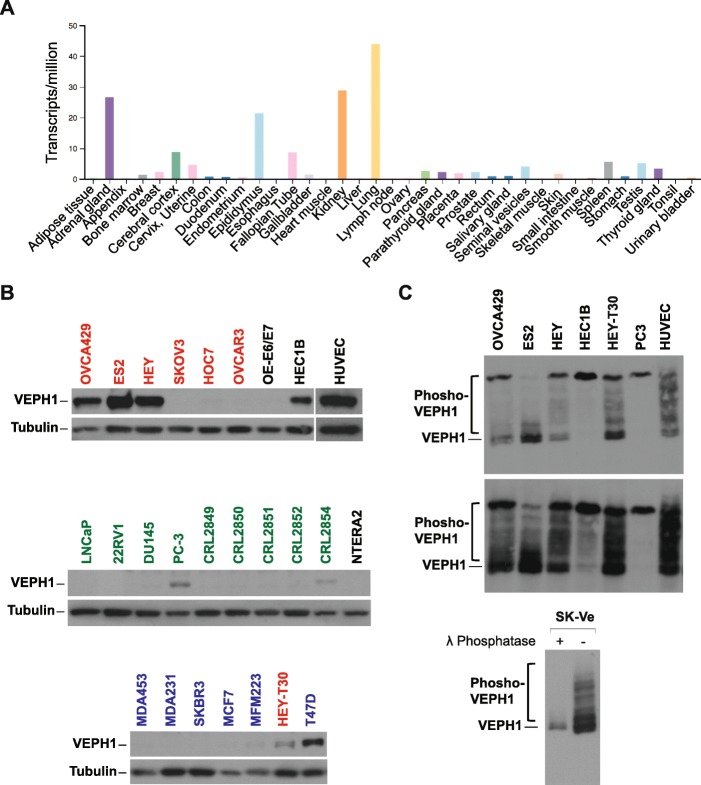
Fig. 3.
Distribution of VEPH1 transcripts in human tissue and VEPH1 protein levels in established cell lines. a VEPH1 transcripts in human tissues reported in the human protein atlas (HPA) RNA dataset (proteinatlas.org). b VEPH1 protein levels expressed by various human cancer cell lines and non-malignant cell lines indicated by western blotting. Red = ovarian cancer cells, blue = breast cancer cells, green = prostate cancer cells, OE-E6/E7 = immortalized fallopian tube epithelial cells, HUVEC = human umbilical vein endothelial cells, HEC1B = endometrial cancer cells, CRL2854 = immortalized prostate fibroblasts, NTERA2 = testicular cancer cells. Data shown for the six ovarian cancer cell lines replicate our previously reported findings [6]. c Differential phosphorylation states of VEPH1 as shown by PhosTag western blot analysis. Shown are two exposure levels (top and middle blots) and results of VEPH1-transfected SKOV3 cells (SK-Ve) treated with or without λ-phosphatase (lower blot)

