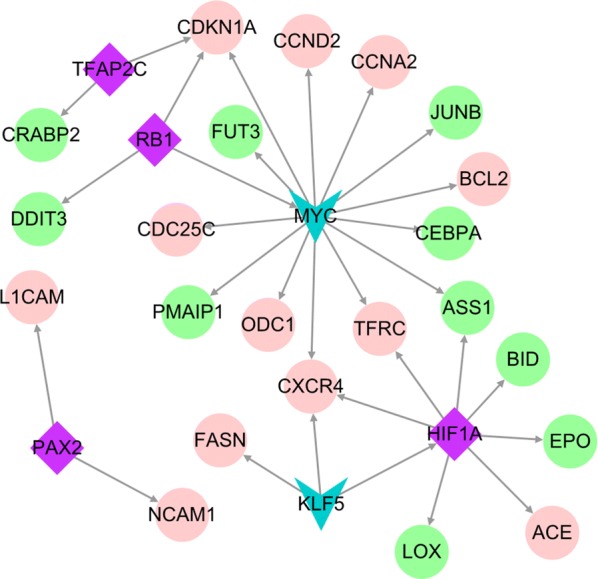
Fig. 4.

TF-target regulation network analysis map. The pink circle and green circle indicate an upregulated gene and a downregulated gene, respectively; the purple diamond and blue inverted triangle indicate an upregulated transcription factor and a down-regulated transcription factor (number of target genes ≥ 2), respectively; and the gray arrow denotes a transcription factor regulatory target gene
