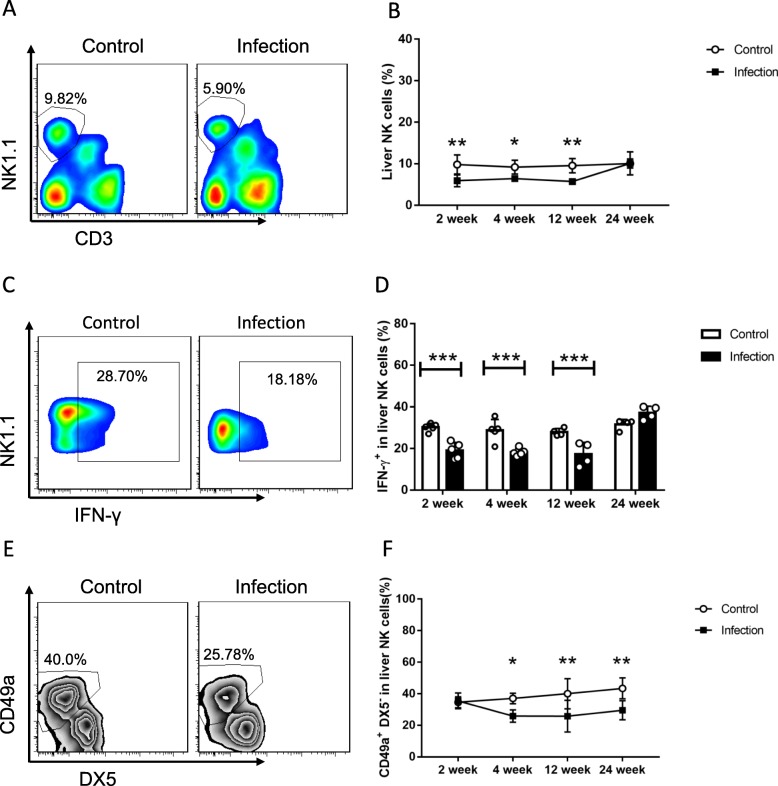
Fig. 1.
The decline in liver NK cells percentage and function in E. multilocularis infection. a Representative FACS plots gated on percentage of liver NK cells after infection. b Percentage of liver NK cells during the different time-points after infection. c Representative FACS plots gated on percentages of liver NK cells secretion of IFN-γafter infection. d The percentages of liver NK cells secretion of IFN-γ during different time points after infection. e Representative FACS plots gated on percentage of CD49a+DX5− NK cells in liver NK cells after infection. f The percentage of CD49a+DX5− liver resident NK cells during the different time points after infection. Data were shown as mean ± standard error (SEM, 4–6 mice per group), *p < 0.05, **p < 0.01, ***p < 0.001

