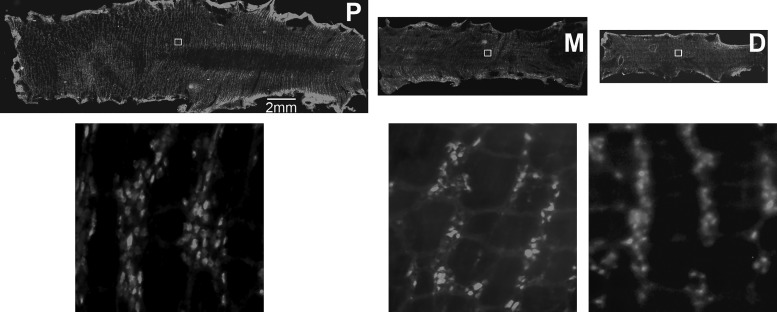
Fig. 4.
Representative image of colon of ChAT-GCaMP3 mice that was opened along the mesenteric border, divided into proximal (P), middle (M), and distal (D) segments, and pinned as a circumferential sheet (upper row of images). The number of fluorescently labeled neurons was quantified in higher-magnification images (lower row) of 500 μm2 squares (inset boxes in upper row).

