Fig. 2.
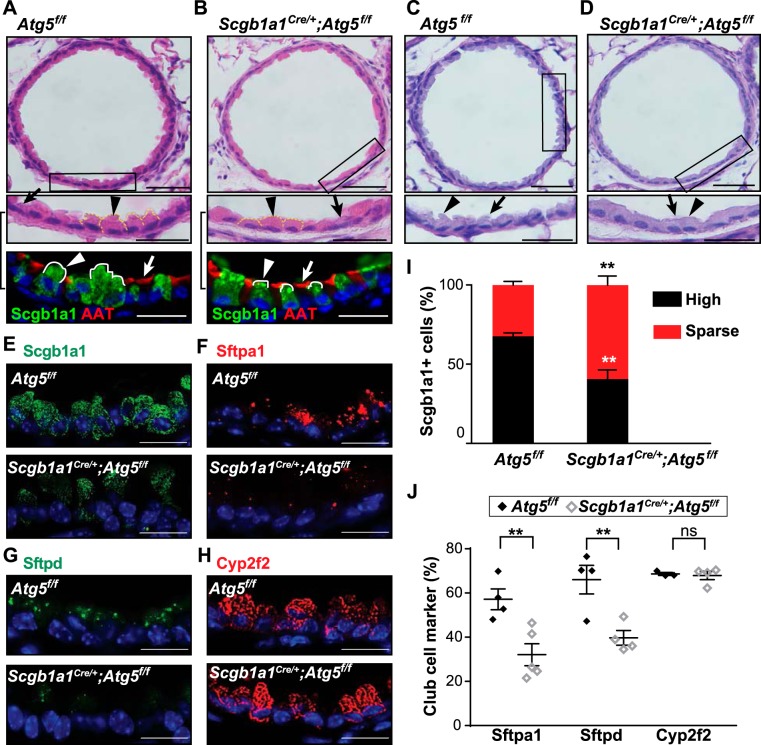
Scgb1a1Cre/+;Atg5 f/f mice have abnormal club cells. A–D: representative images of small airways stained with hematoxylin and eosin (A and B) and periodic acid-Schiff (C and D) for autophagy-related 5 (Atg5f/f) and secretoglobulin family 1A member 1 (Scgb1a1Cre+);Atg5f/f mice. Scale bars = 100 µm. Insets show regions within black boxes (scale bars = 10 µm). Images of similar magnification from parallel sections stained with Scgb1a1 and acetylated α-tubulin (AAT) are shown below hematoxylin-and-eosin insets. Arrows indicate ciliated cells; arrowheads indicate club cells. E–H: sections of lung from indicated genotypes immunostained for Scgb1a1 (green), surfactant protein A1 (Sftpa1) antibody (red), surfactant protein D (Sftpd, green), and anti-cytochrome P-450 family 2, subfamily f, polypeptide 2 (Cyp2f2, red); nuclei are stained with bis-benzamide (blue). Scale bars = 10 µm. I: percentage of high and sparse Scgb1a1-positive airway cells. Scgb1a1-positive cells were subdivided into those with high or sparse amounts of cytoplasmic puncta (see materials and methods). Values are means ± SE; n = 4–6 mice/group performed in 3 independent experiments; n = 4–6 well-orientated airways/mouse. **P < 0.01 (by one-way ANOVA with Tukey’s multiple comparison test). J: percentage of club cells that are positive for the indicated markers comparing Atg5f/f and Scgb1a1Cre+;Atg5 f/f mice. Values are means ± SE; n = 4–5 mice/group performed in 3 independent experiments; n = 4–6 well-orientated airways/mouse. **P < 0.01 (by Mann-Whitney U-test).

