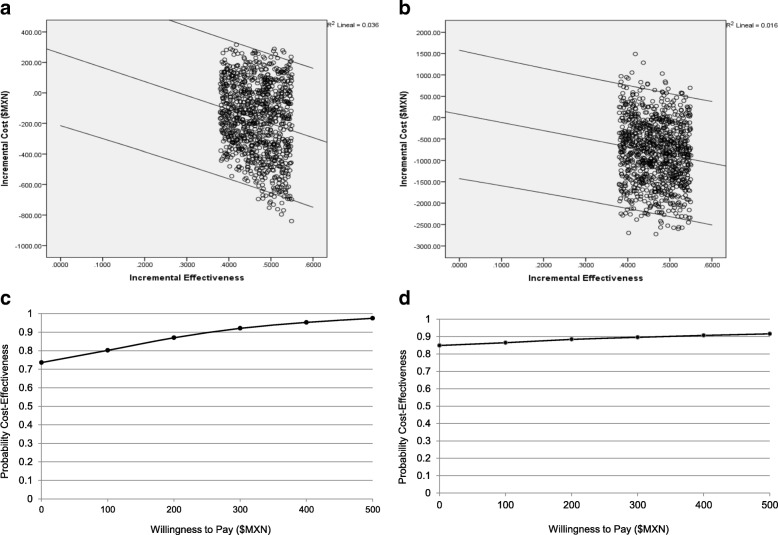
Fig. 2.
Cost-effectiveness and acceptability of OM-85 treatment for acute respiratory tract infection. (a, b) Incremental cost vs. incremental effectiveness plots show the mean differences in the costs and outcomes of OM-85 treatment compared to typical treatments, based on data from 1000 bootstrap replicates. Negative costs represent savings with OM-85 compared to typical treatments. (a) Direct costs; (b) direct costs plus parental absenteeism cost (i.e., the cost of one parent missing work to care for the child). Lines show the mean and 95% confidence intervals; (c, d) Probability of cost-effectiveness vs. willingness to pay curves show the probability that OM-85 treatment would be cost-effective, based on how much the payer is willing to pay. (c) Direct costs; (d) direct costs plus parental absenteeism cost

