Fig. 1.
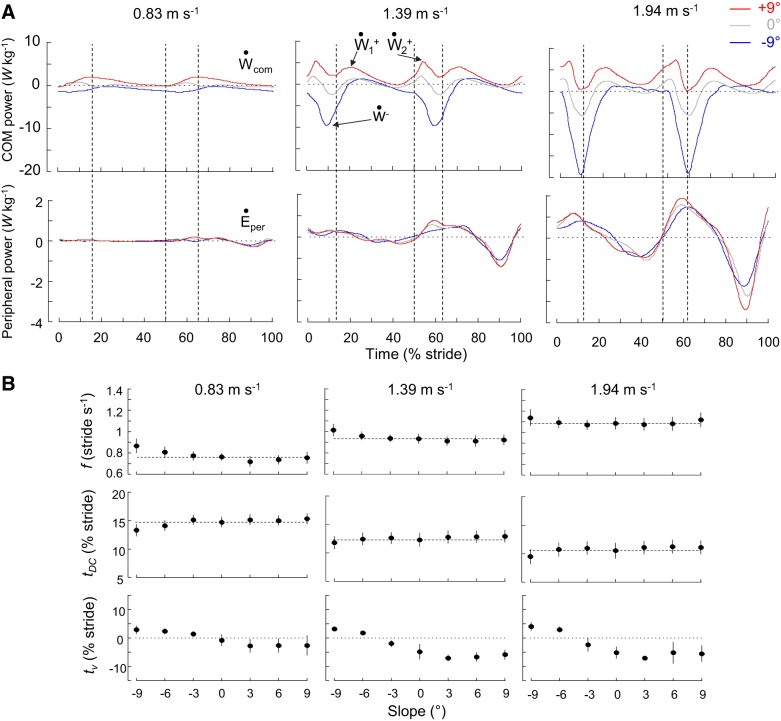
Center of body mass (COM) and peripheral power and stride parameters during walking at 0.83, 1.39, and 1.94 m/s on different slopes. A: ensemble-averaged time curves (see methods) of the mass-specific COM (top) and peripheral (bottom) powers (also referred to as external and internal power) during walking at 0.83, 1.39, and 1.94 m/s on a −9°, 0°, or +9° slope. Time is expressed as % of stride period (0% and 100% of stride correspond to the right foot contact). Vertical dashed lines correspond to foot contact (50% of stride corresponds to the left foot contact) and toe-off. Note that at a given speed curves of the peripheral power are similar across slopes, whereas curves of the COM power change drastically with slope. Ẇcom, COM power; , positive portion; , negative portion; Ėper, peripheral power. B: gait parameters (means ± SD) as a function of slope in the 3 speed-classes. Gait parameters are, from top to bottom: stride frequency (f), relative duration of the double contact phase (tDC), and the time between touchdown and the minimum vertical velocity of the COM (tv). tDC and tv are expressed in % of stride period. The horizontal dashed lines correspond to level walking. Symbols and bars represent the grand mean and the SD (when the length of the bar exceeds the size of the symbol).

