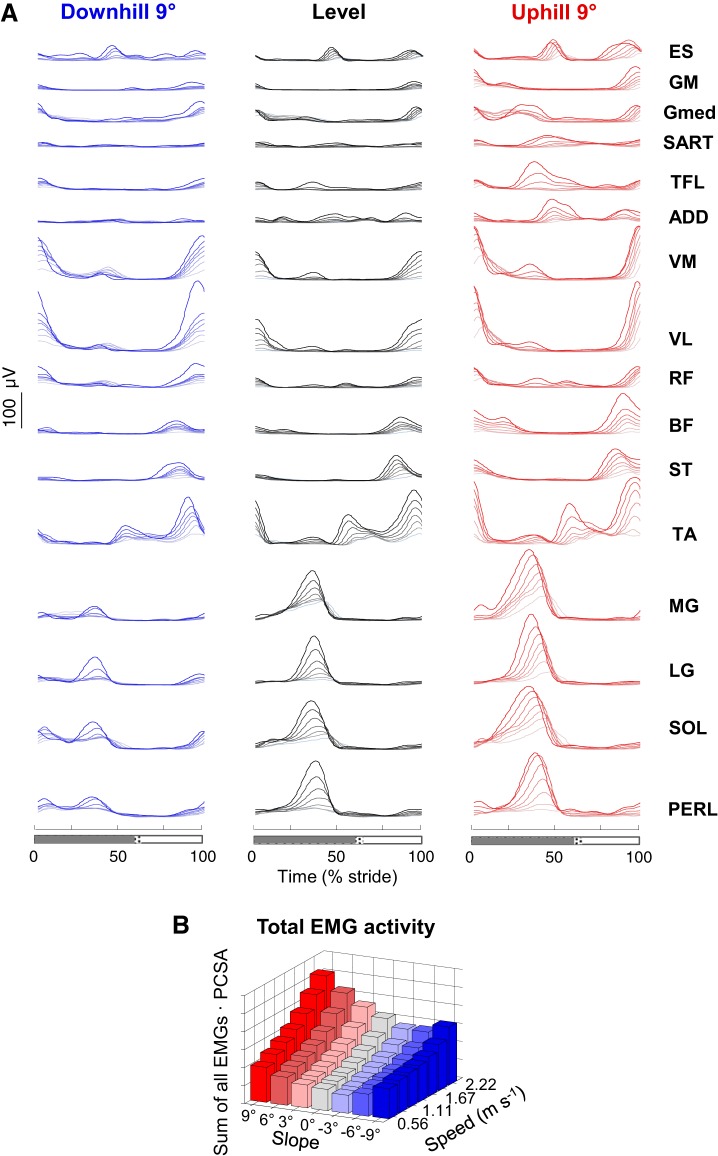
Fig. 2.
Ensemble-averaged electromyogram (EMG) patterns during walking at different speeds and slopes. A: ensemble-averaged EMG patterns during walking at different speeds (color intensity increases with speed) on a −9° slope (left), on the level (center), and on a +9° slope (right). ES, erector spinae; GM, gluteus maximus; Gmed, gluteus medius; SART, sartorius; TFL, tensor fascia latae; ADD, adductor longus; VM, vastus medialis; VL, vastus lateralis; RF, rectus femoris; BF, biceps femoris; ST, semitendinous; TA, tibialis anterior; MG, gastrocnemius medialis; LG, lateral gastrocnemius; SOL, soleus; PERL, peroneus longus. Stance (gray bar) and swing (white bar) are shown at bottom. As the relative duration of stance varied with speed, a hatched region also indicates an amount of variability in the stance phase duration across speeds. B: total EMG activity normalized to the physiological cross-sectional area (PCSA) of muscles (Ward et al. 2009) at all speeds and slopes. Note a minimum between −3° and −6° slope depending on the walking speed.

