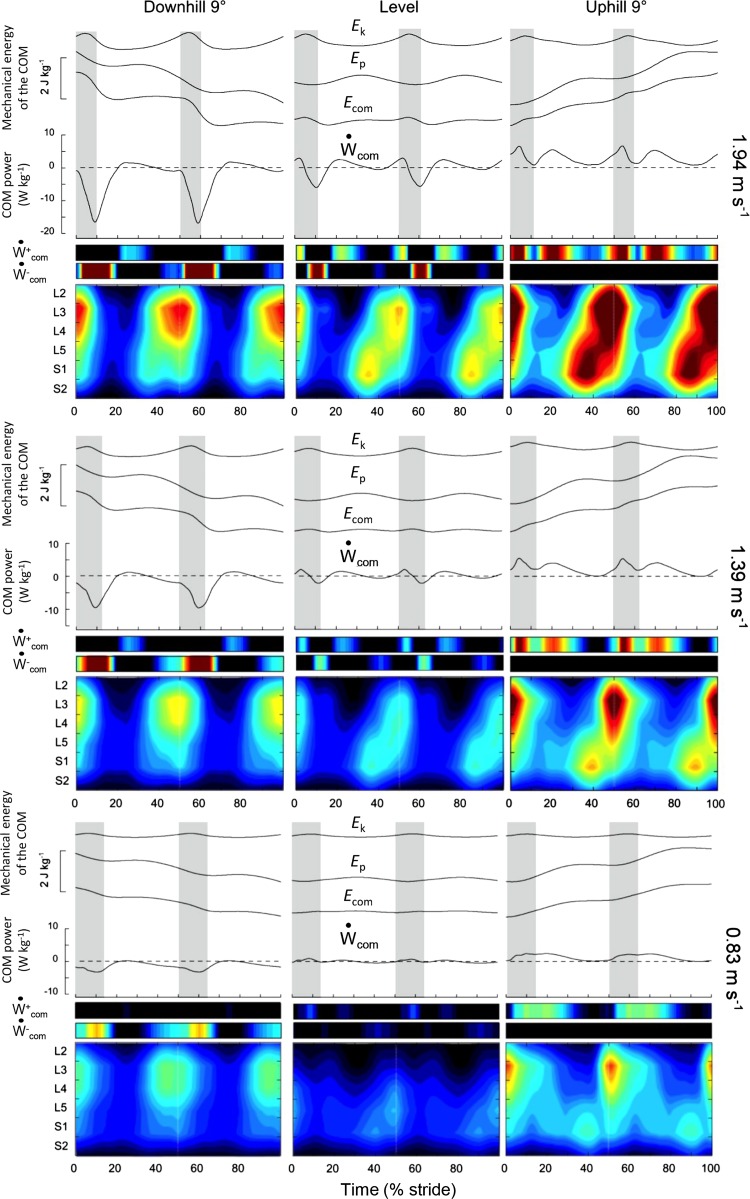
Fig. 5.
Mechanical energy of the center of body mass (COM) motion and spinal maps during walking at 0.83, 1.39, and 1.94 m/s on a −9° slope (left), on the level (center), and on a +9° slope (right). Top: the ensemble-averaged mass-specific mechanical energy-time curves of the COM during a stride. Ek, the kinetic energy of the COM; Ep, its gravitational potential energy; Ecom, the total energy of the COM (Ecom = Ek + Ep). Middle: the COM power (Ẇcom, black curves) and its positive () and negative () portions (color scale). Gray zones correspond to the double contact periods. Bottom: color plots refer to the bilateral spinal maps of motoneuron activity (the same format as in Fig. 4).

