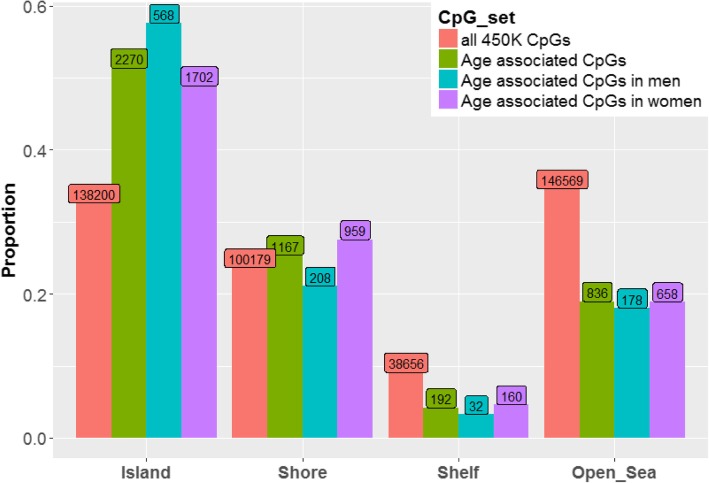
Fig. 4.
Proportion of CpGs residing in genomic regions defined by CpG density. All but the red bar represents age-associated CpGs. Fisher exact tests comparing enrichment/depletion within individual categories to all categories were significant (p < 2 x 10-11) among men for island, shelf, and open sea regions and among women for all four categories (p = 3.8 x 10⁻⁵). Fisher exact tests comparing enrichment/depletion within categories between men and women were significant for island (p = 0.0071) and shore (p = 0.0015) regions

