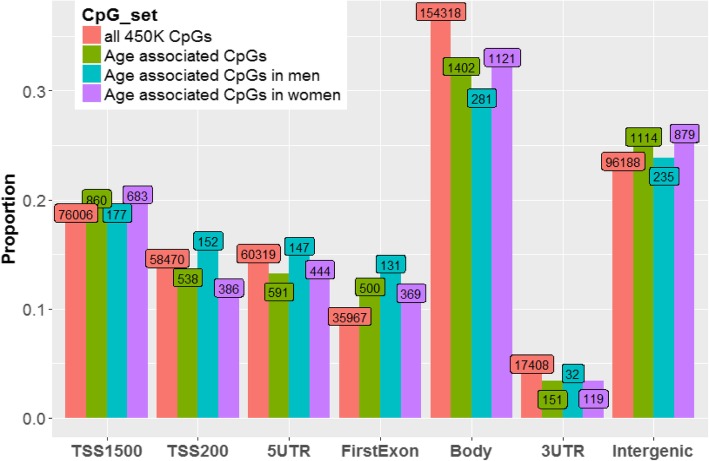
Fig. 6.
Proportion of age-associated CpGs residing in regions defined by gene features. The red bar represents all measured CpGs. Fisher exact tests comparing enrichment/depletion within individual categories to all categories were significant among men for first exon (p = 5.7 x 10⁻⁶) and body (p = 0.0002) regions and among women for TSS1500 (p = 0.0337), TSS200 (p = 3.5 x 10⁻⁵), 5′ UTR (p = 0.0307), first exon (p = 7.9 x 10⁻⁵), body (p = 0.0003), and intergenic (p = 0.0054). Fisher exact tests comparing enrichment/depletion within individual categories between men and women were significant for TSS200 (p = 0.0016) and first exon (p = 0.0419)

