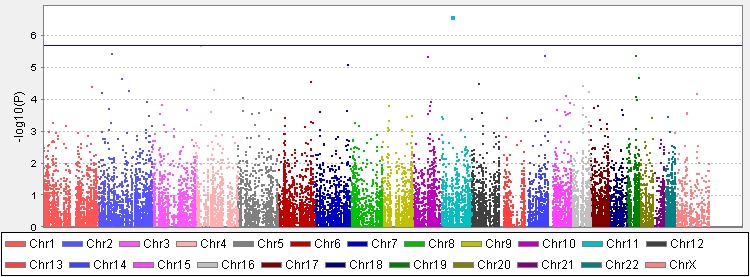
Figure 1.

The Manhattan plot based on the data obtained from the allelic association test. The x-axis represents the chromosomal location of the studied single nucleotide polymorphisms (SNPs). The y-axis is –log10(P value). The solid horizontal line corresponds to the Bonferroni-adjusted significance threshold, a P value of 2.1 × 10⁻⁶.
