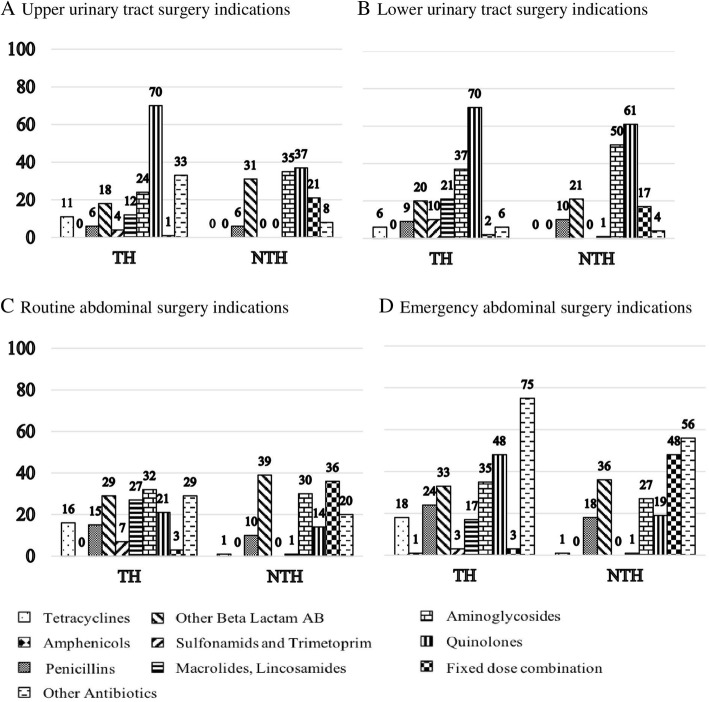
Fig. 2.
Proportions of inpatients prescribed antibiotics in selected non-infectious surgical diagnoses groups (a to d) in two study hospitals. Numbers in graphs indicate percentages of patients and are rounded off to nearest integers. AB, antibiotics; N, total number of prescriptions in the diagnosis group; n, number of prescriptions for the third-level ATC pharmacological sub-group; TH, teaching hospital; NTH, non-teaching hospital

