Fig. 5.
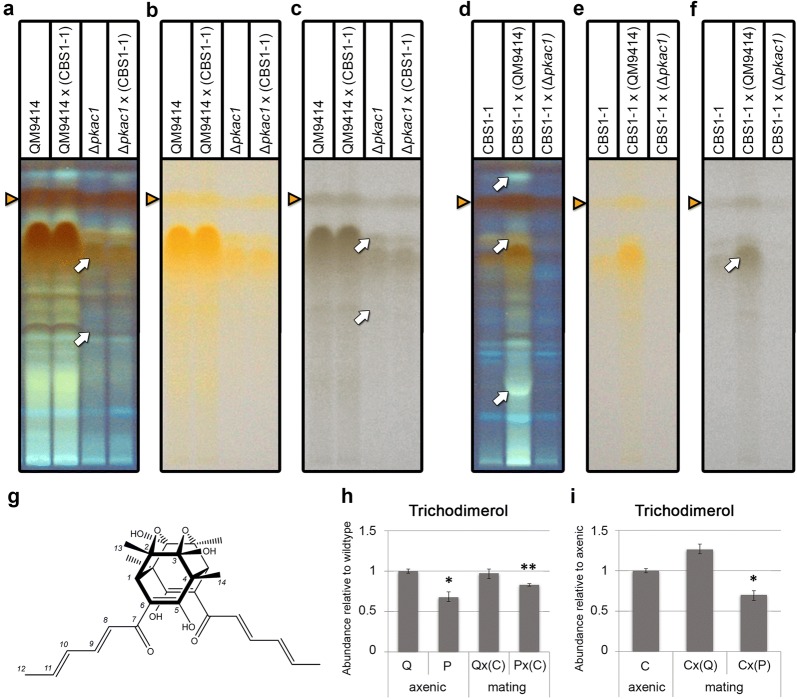
Detection and quantification of trichodimerol. a–f High performance thin layer chromatography (HPTLC) analysis of ∆pkac1. Triangles show trichodimerol. Arrows highlight major differences between samples. Secondary metabolite patterns of ∆pkac1 and wildtype QM9414 under asexual and crossing conditions (a–c) and reaction of CBS1-1 after 14 days (d–f) on 2% MEX at 22 °C, LD. Visualization: a, d fluorescence at 366 nm, b, e visible light, c, f visible light with low saturation for better illustration. Analyses were done in three biological replicates with tree pooled plates per replicate. Replicates for HPTLC analysis were consistent and are provided in Additional file 5. g Trichodimerol. HR ESI–MS m/z 497.2164 [M+H]+ (calcd for C28H33O8, 497.2175), m/z 519.1994 [M+Na]+ (calcd for C28H32O8Na, 519.1995); 1H NMR (600 MHz, CD3OD): δH = 7.29 (1H, dd, J = 14.9 Hz, J = 10.9 Hz, H-9), 6.39 (1H, dd, J = 15.0 Hz, J = 10.9 Hz, H-10), 6.35 (1H, d, J = 14.9 Hz, H-8), 6.24 (1H, dq, J = 15.0 Hz, J = 7.0 Hz, H-11), 3.11 (1H, s, H-1), 1.92 (3H, d, J = 7.0 Hz, H-12), 1.40 (3H, s, H-14), 1.38 (3H, s, H-13); 13C NMR (150 MHz, CD3OD): δC = 201.3 (s, C-5), 175.8 (s, C-7), 144.1 (d, C-9), 140.8 (d, C-11), 132.7 (d, C-10), 120.2 (d, C-8), 105.7 (s, C-3), 104.6 (s, C-6), 80.3 (s, C-2), 60.9 (s, C-4), 58.6 (d, C-1), 21.7 (q, C-13), 19.8 (q, C-14), 18.7 (q, C-12). Numbering of protons and carbons is shown. All data in agreement with those reported earlier for this compound [79]. h Quantification of trichodimerol in axenic growth in the parental strain QM9414 (Q) and in ∆pkac1 (P) compared to interaction with the fully fertile strain CBS999.97 MAT1-1 (C) under conditions favoring sexual development (corresponds to HPTLC data on panel D). i Quantification of trichodimerol in axenic growth in CBS999.97 MAT1-1 compared to interaction with QM9414 and ∆pkac1 under conditions favoring sexual development (corresponds to HPTLC data on panel c). Error bars reflect standard deviations, *p-value < 0.05 and **p-value < 0.01

