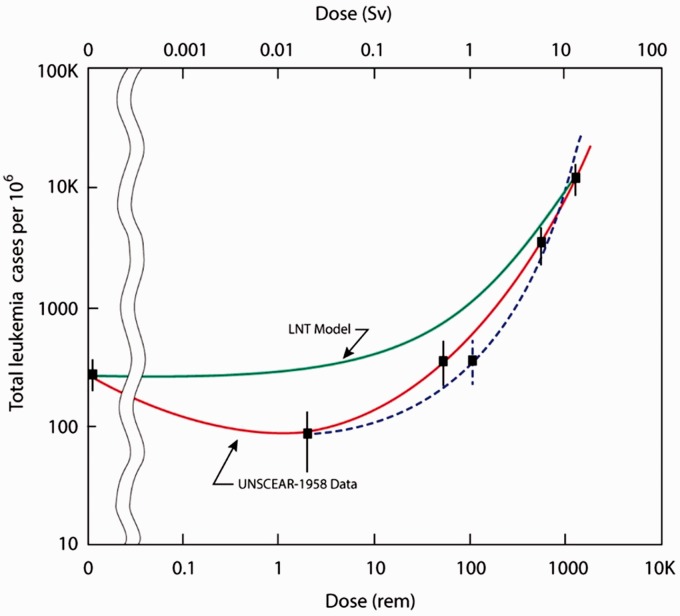
Figure 1.
Actual leukaemia incidence (UNSCEAR data) in the Hiroshima survivors for 1950–57. Graphic extrapolation based on estimated dose (±standard error) compared with LNT model. The dotted line represents a re-estimate of the doses because many of these individuals had features of radiation complications indicating a potential underestimation of their dose based on distance alone. Source: Reproduced from Cuttler18 under CC-BY-NC license.

