Fig. 2.
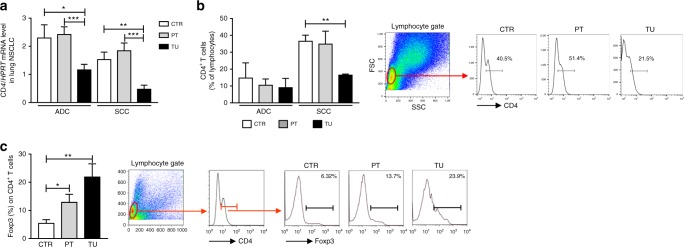
Decreased CD4+ T cell number and increased T regulatory cells expressing Foxp3 in the tumoural (TU) region of patients with non-small cell lung cancer (NSCLC). a Quantitative real-time PCR-based analysis of CD4 mRNA expression in human lung tissue samples from the TU, peritumoural (PT), and control (CTR) region of patients suffering from adenocarcinoma (ADC) (ADCCTR = 34, ADCPT = 30, ADCTU = 31) or squamous cell carcinoma (SCC) (SCCCTR = 23, SCCPT = 22, SCCTU = 23) collectively grouped as NSCLC. b Flow cytometric analyses of CD4+ T cells (%) in total lung cell suspensions obtained from of the CTR, PT, and TU lung region of patients who suffered from ADC (ADCCTR = 2, ADCPT = 2, ADCTU = 2) or SCC (SCCCTR = 3, SCCPT = 3, SCCTU = 3) subtypes. c Flow cytometric analyses of Foxp3 in CD4+ T cells (%) in total lung cell suspension of the CTR, PT, and TU region of NSCLC patients (ADCCTR = 4, ADCPT = 4, ADCTU = 4; SCCCTR = 1, SCCPT = 1, SCCTU = 1). Representative dot plots of the gating strategy for CD4+ T cells and of Foxp3+ in CD4+ T cells are depicted (left, b, c). Data are presented as mean ± SEM and significance levels are indicated as follows: *p < 0.05, **p < 0.01, ***p < 0.001

