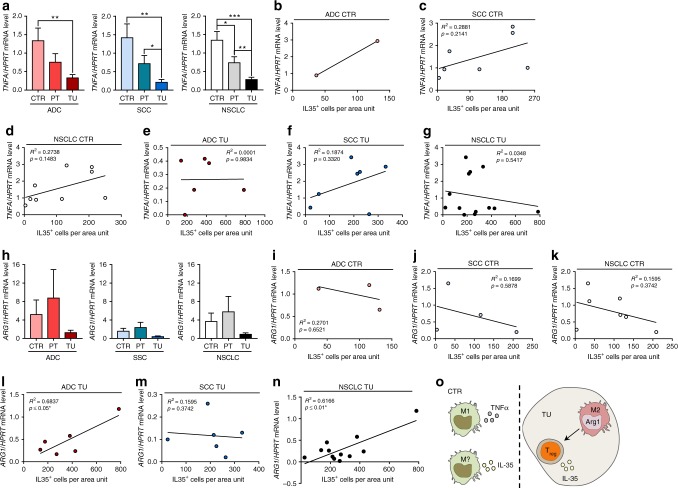
Fig. 5.
Correlation of interleukin (IL)-35 and Arginase-1 (Arg1) in the tumoural (TU) region of non-small cell lung cancer (NSCLC) patients. a Quantitative real-time PCR (qPCR)-based analysis of TNFA mRNA expression in human lung tissue samples from the TU, peritumoural (PT), and control (CTR) region of patients suffering from adenocarcinoma (ADC) (ADCCTR = 11, ADCPT = 10, ADCTU = 13) or squamous cell carcinoma (SCC) (SCCCTR = 7, SCCPT = 7, SCCTU = 9) collectively grouped as NSCLC. b–d Correlation between TNFA/HPRT mRNA level and IL-35+ cells per area unit detected via immunohistochemistry (IHC) in the CTR lung tissue of ADC (b, ADCCTR = 2) and SCC (c, SCCCTR = 7) subtypes collectively grouped as NSCLC (d, NSCLCCTR = 9) lung cancer. e–g Correlation between TNFA/HPRT mRNA level and IL-35+ cells per area unit detected via IHC in the TU lung tissue of ADC (e, ADCTU = 6) and SCC (f, SCCTU = 7) subtypes collectively grouped as NSCLC (g, NSCLCTU = 13) lung cancer. h qPCR-based analysis of ARG1 mRNA expression in human lung tissue samples from the TU, PT, and CTR region of patients suffering from ADC (ADCCTR = 25, ADCPT = 16, ADCTU = 24) or SCC (SCCCTR = 19, SCCPT = 14, SCCTU = 17) collectively grouped as NSCLC. i–k Correlation between ARG1/HPRT mRNA level and IL-35+ cells per area unit detected via IHC in the CTR lung tissue of ADC (i, ADCCTR = 3) and SCC (j, SCCCTR = 4) subtypes collectively grouped as NSCLC (k, NSCLCCTR = 7) lung cancer. l–n Correlation between ARG1/HPRT mRNA level and IL-35+ cells per area unit detected via IHC in the TU lung tissue of ADC (l, ADCTU = 6) and SCC (m, SCCTU = 6) subtypes collectively grouped as NSCLC (n, NSCLCTU = 12) lung cancer. o The immunosuppressive role of IL-35 in NSCLC: in the solid tumour, Arg1+ M2 macrophages attract IL-35-producing inducible Treg cells (iTr35), which support lung tumour growth. In the control region, a new macrophage subtype seems to secrete IL-35, which further promotes an immunosuppressive environment and supports the development of NSCLC. Data are presented as mean ± SEM and significance levels are indicated as follows: *p < 0.05, **p < 0.01, ***p < 0.001

