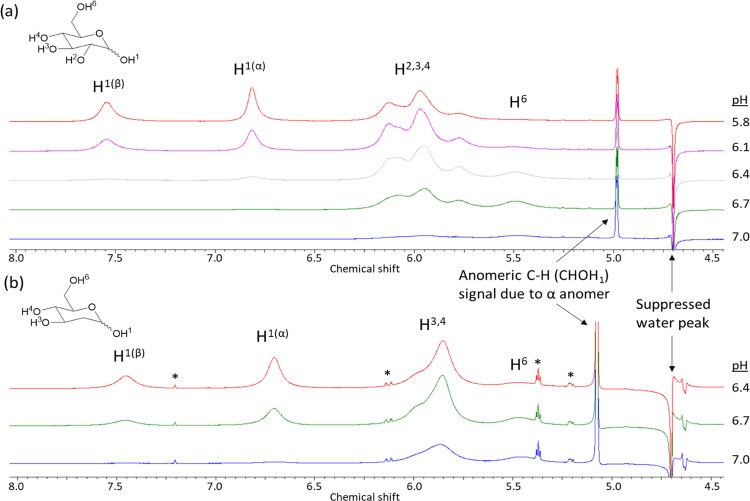
Figure 2.
1H NMR spectra of 0.5 M monosaccharides in DI water with 20% PBS at various pH values, (a) 0.5 M glucose at pH values 5.8, 6.1, 6.4, 6.7, and 7.0, (b) 0.5 M 2-DG at pH values 6.4, 6.7, and 7.0. The suppressed water and anomeric C–H signals are labeled, and asterisks mark impurities present in the commercially available 2-DG.

