
Figure 4.
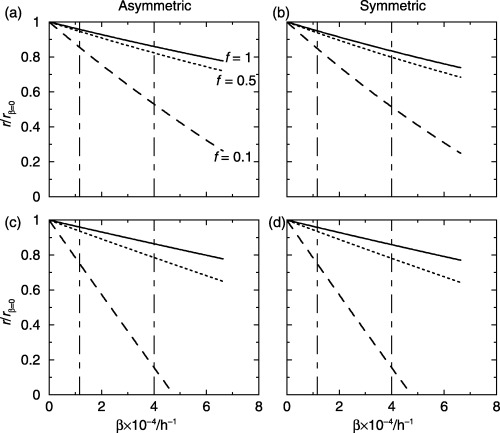
The effect of apoptosis on the cell birth rates per unit area of skin surface. The curves are the ratios of birth rate with apoptosis to birth rate without apoptosis. There is little difference between asymmetric and symmetric division, compare (a) with (b) and (c) with (d). (a,b) T̄ s = T̄ t = 100 h and (c,d) T̄ s = 200 h and T̄ t = 20 h, with β s = β t = β’ g = 3, φ s = φ t = 0.1 and gamma distributed cell‐cycle times. The two vertical lines represent the apoptotic rates in normal (right) and psoriatic (left) skin.