
Figure 2.
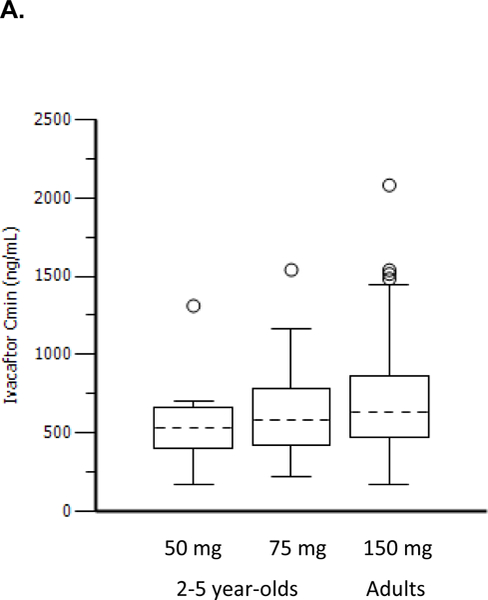
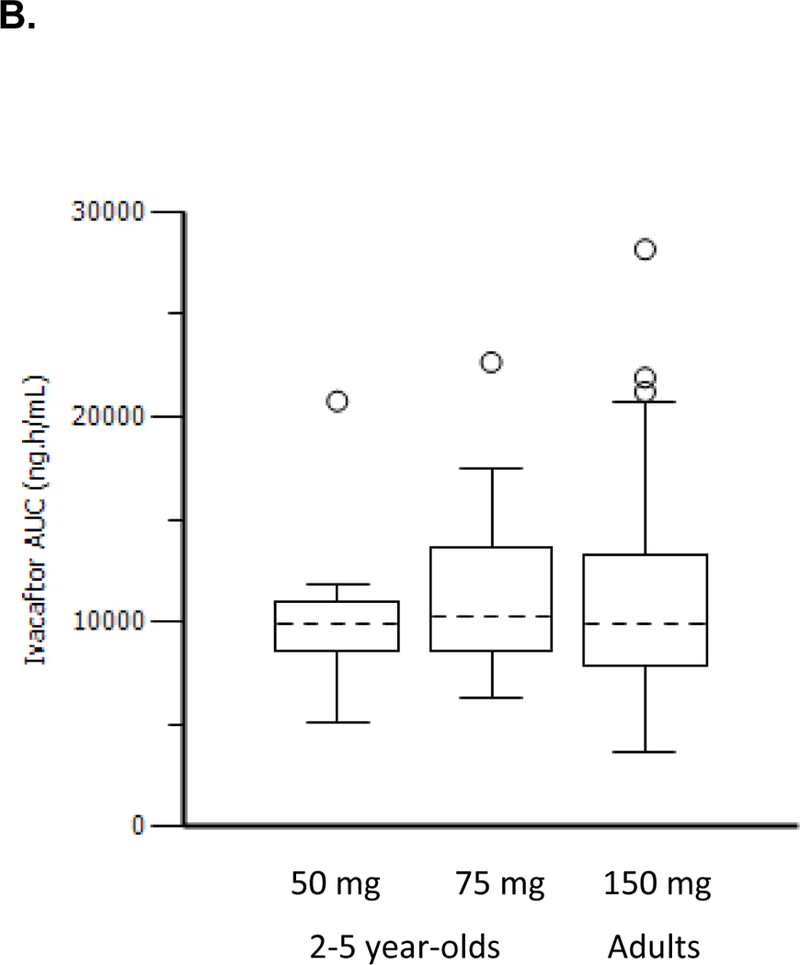
Ivacaftor Cmin distribution (A) and ivacaftor AUC distribution (B) in children aged 2–5 years compared with adults from previous Phase 3 studies.
Dashed black lines in the center of the boxes are medians, boxes are the interquartile range (IQR), whiskers are 1·5•IQR, and open circles are outliers.
AUC, area under the plasma drug concentration-vs-time curve; Cmin, minimum plasma drug concentration.