
Figure 8.
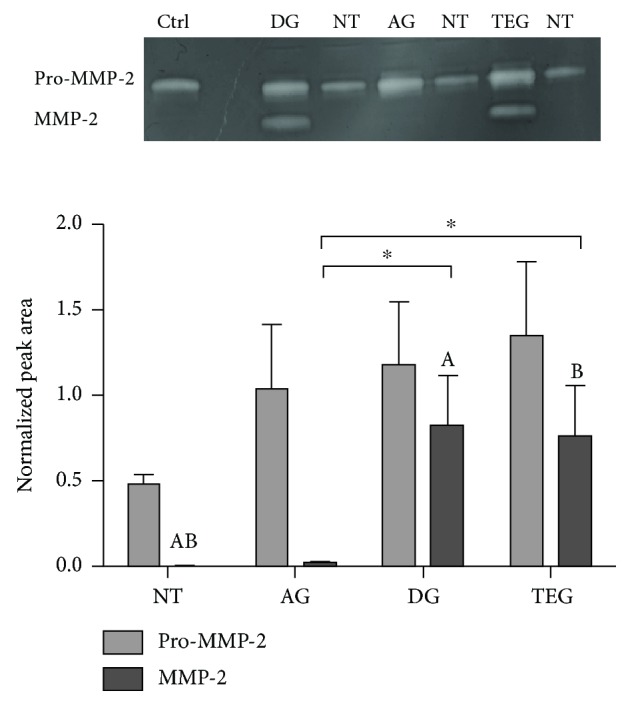
Expression and enzymatic activity of MMP-2. Bands at 72 and 62 kD represent the latent (Pro) and the active form of MMP-2, respectively. The values of the normalized peak areas on the reference control (Ctrl) are reported as the mean ± SEM (n = 6). There was no significant change in 72 kD bands among the treated tendons and between treated tendons and NT. In 62 kD bands, the activity was significantly higher in DG and TEG compared to NT for p < 0.01 (A) and p < 0.001 (B). A significantly higher activity was detected between DG and TEG compared to AG (p < 0.05).