Figure 1.
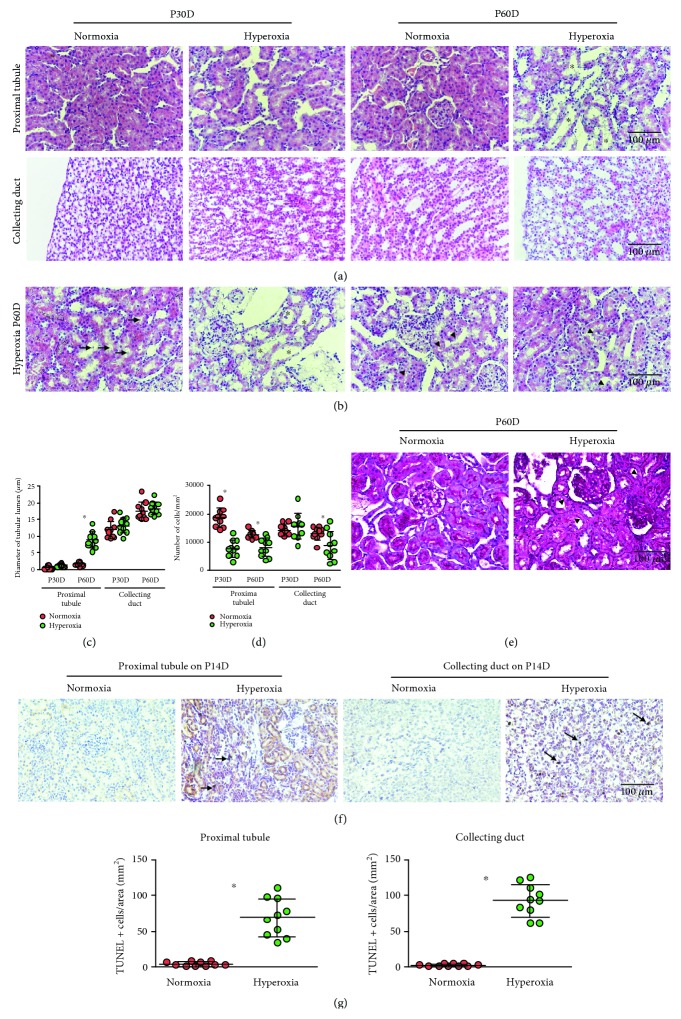
Neonatal hyperoxia dilates the lumen and decreases the cell density of mature proximal tubules. (a) The proximal tubules and collecting ducts of adult rats, including those from the 30th (P30D) and 60th postnatal days (P60D), exposed to neonatal normoxia or hyperoxia were detected by hematoxylin & eosin (H&E) staining (original magnification ×400; scale bar, 100 μm). Asterisks show tubular dilation. (b) The proximal tubules from the hyperoxia group on P60D showing intratubular debris (arrows), thinner tubules (asterisks), and vacuolation (arrowheads) were detected by H&E staining (original magnification ×400; scale bar, 100 μm). (c) The lumen diameters of the proximal tubules and collecting ducts from adult rats exposed to neonatal normoxia or hyperoxia are shown (mean ± standard deviation (SD)) by scatter dot plots. The error bars represent the SD of measurements for 10 rats with the mean value of 10 separate fields of view (n = 10). ∗P < 0.001, one-way ANOVA, Bonferroni post hoc test. (d) The cell densities of the proximal tubules and collecting ducts from adult rats exposed to neonatal normoxia or hyperoxia (mean ± SD) are shown by scatter dot plots. The error bars represent the SD of measurements for 10 rats with the mean value of 10 separate fields of view (n = 10). ∗P < 0.05, one-way ANOVA, Bonferroni post hoc test. (e) The proximal tubules from the hyperoxia group on P60D showing discontinuous brush border (arrowheads) were detected by Periodic Acid-Schiff (PAS) staining (original magnification ×400; scale bar, 100 μm). (f) Apoptosis in the proximal tubules and collecting ducts from newborn rats exposed to normoxia or hyperoxia and harvested on the 14th postnatal day (P14D) was detected by terminal deoxynucleotidyl transferase dUTP nick end labeling (TUNEL) assay (original magnification ×400; scale bar, 100 μm). Arrows indicate apoptotic bodies. (g) TUNEL positive cell numbers in mm2 of the proximal tubules and collecting ducts from newborn rats exposed to normoxia or hyperoxia and harvested on the 14th postnatal day are shown (mean ± SD) by scatter dot plots. The error bars represent the SD of measurements for 10 rats with the mean value of 10 separate fields of view (n = 10). ∗P < 0.001, Student's t-test.

