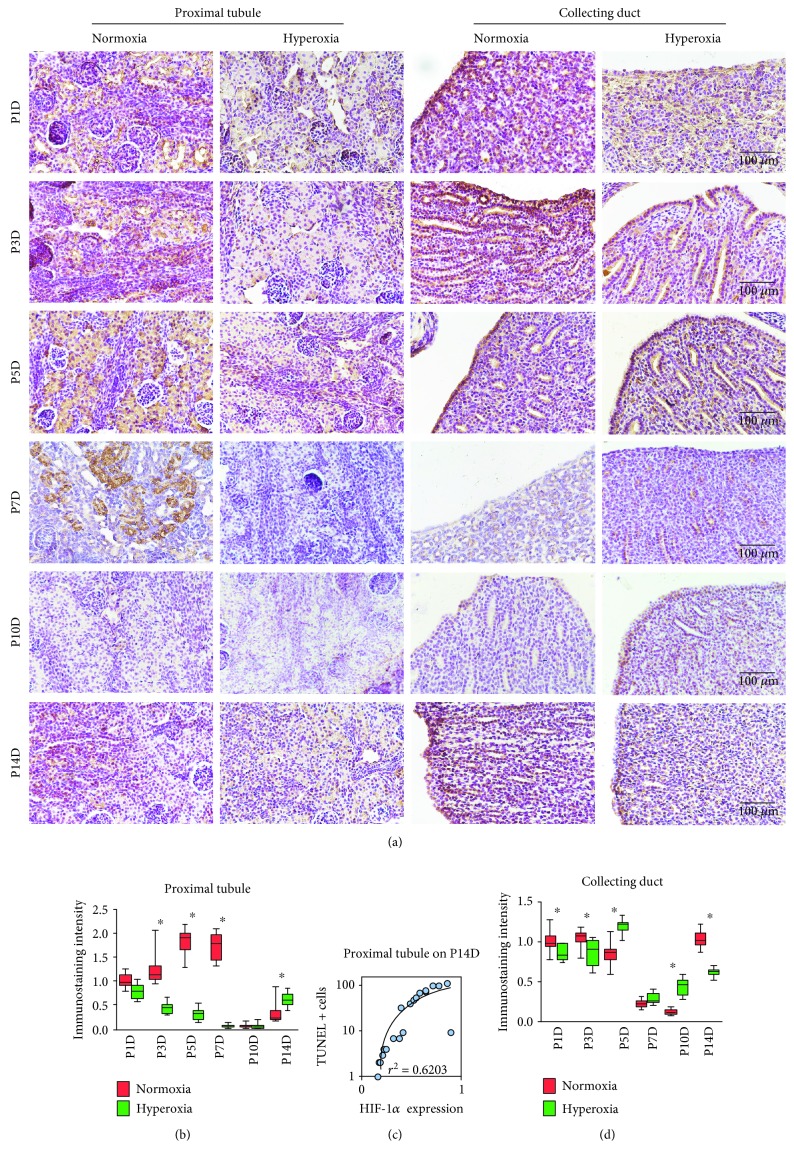
Figure 4.
Hyperoxia downregulates hypoxia-inducible factor 1α (HIF-1α) expression in the proximal tubules and collecting ducts. (a) HIF-1α expression in the proximal tubules and collecting ducts of newborn rats exposed to normoxia or hyperoxia was detected by immunohistochemical staining (original magnification ×400; scale bar, 100 μm). (b) The immunostaining intensity of HIF-1α expression in the proximal tubules from newborn rats exposed to normoxia or hyperoxia is shown by box and whisker plots. Relative expression is standardized to the value of the normoxia group on P1D. The whiskers represent the minimal intensity or the maximal intensity, and the boxes span the interquartile range of measurements for 10 rats with the mean value of 10 separate fields of view (n = 10). ∗P < 0.01, one-way ANOVA, Bonferroni post hoc test. (c) Linear correlation between relative immunostaining intensity of HIF-1α and TUNEL positive cell number per mm2 in the proximal tubules from newborn rats exposed to hyperoxia or normoxia and harvested on the 14th postnatal day. The graph was plotted using a log-10 scale for just the Y axis. The correlation coefficient (r2 = 0.6203) was found to be highly significant as shown in the graph (n = 20, P < 0.001). Simple regression. (d) The immunostaining intensity of HIF-1α expression in the collecting duct from newborn rats exposed to normoxia or hyperoxia is shown by box and whisker plots. Relative expression is standardized to the value of the normoxia group on P1D. The whiskers represent the minimal intensity or the maximal intensity, and the boxes span the interquartile range of measurements for 10 rats with the mean value of 10 separate fields of view (n = 10). ∗P < 0.05, one-way ANOVA, Bonferroni post hoc test.

