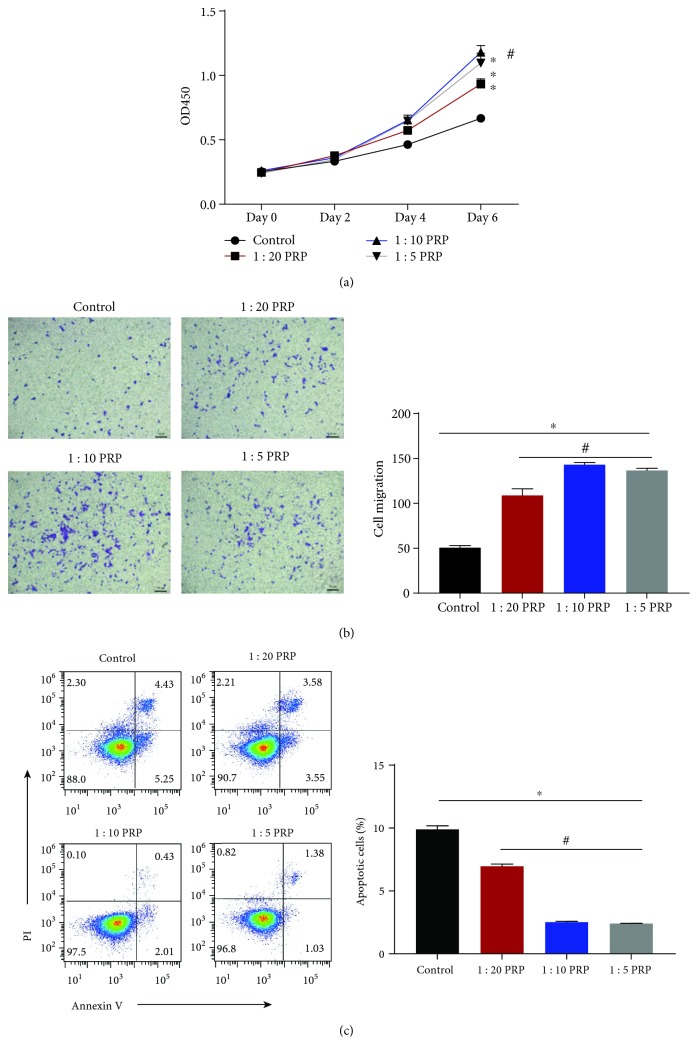
Figure 1.
EPC apoptosis, proliferation, and migration in each group. (a) EPC proliferation in each group at days 0, 2, 4, and 6 is shown as the OD450 value. (b) EPC migration assay. The number of migrating EPCs was analyzed and is shown as a bar chart. (c) The percentage of apoptotic EPCs is shown as a bar chart. ∗p < 0.05 for the treatment group vs. the control group and #p < 0.05 for the 1 : 10 PRP group vs. the other concentration groups.

