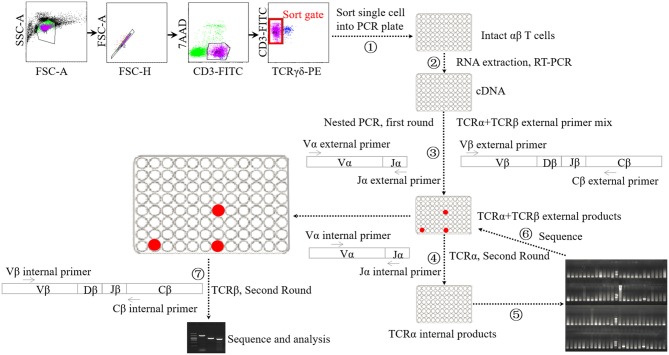
Figure 1.
Schematic diagram of single-cell PCR assay. ① Sorting single αβ T cell into 96-well PCR plate. ② Performing cDNA synthesis on individual cells in 96-well plate without RNA extraction step. ③ Performing the first-round nested PCR with external primers targeting α chain and β chains using resultant cDNA. ④ Performing the second-round PCR with internal primers targeting α chain using the products of first-round nested PCR. ⑤ Electrophoresis analysis of the products of forth step. ⑥ Sequencing analysis of the products of suspected positive TRAV1-TRAJ33 cell. ⑦ Performing the second-round PCR with internal primers targeting β chains using the products of TRAV1-TRAJ33+ cells.

