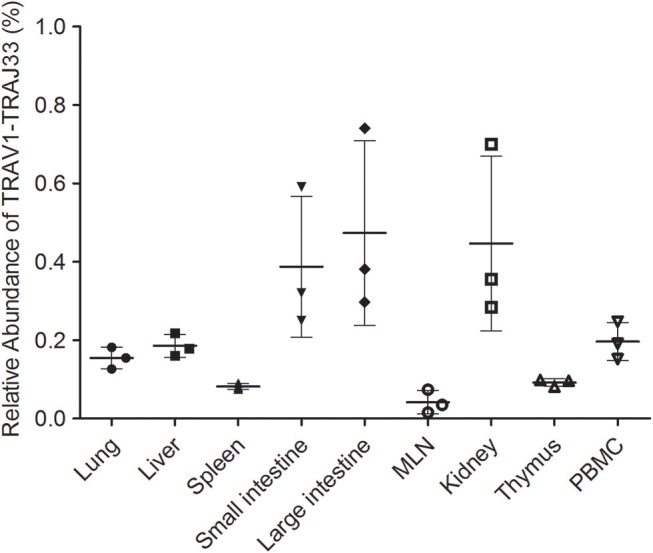
Figure 3.

Relative abundance of pMAIT TCRα in PBMC and tissues. Two qPCR amplifications were performed with each cDNA sample prepared from PBMC and tissues to analyze the expression of MAIT TCR Vα-Jα and total TCRα (Cα). The relatively abundance of MAIT TCRα mRNA in total TCRα cDNA then was determined through taking the ratio of Vα-Jα/Cα. Samples are taken from three pigs, and data are representative of three experiments on the same samples from each pig. Bars indicate mean ± SD. MLN, mesenteric lymph node; PBMC, peripheral blood mononuclear cell.
