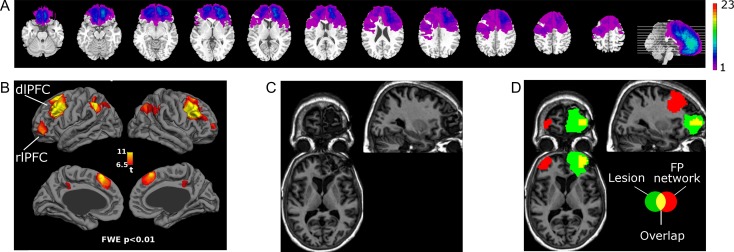
Figure 2.
(A) Voxel-wise overlap of lesion across all 23 patients. Scale indicates number of patients with lesion in a given voxel. (B) Fronto-parietal (FP) network defined using resting-state fMRI in an independent pool of 26 healthy participants (Sadaghiani et al. 2012). (C) Structural image showing lesion in a single patient (subject 17) with lesion to right rlPFC node of the FP network. (D) Overlap of this patient’s lesion with the FP network, demonstrating assessment of % lesion to the FP network.

