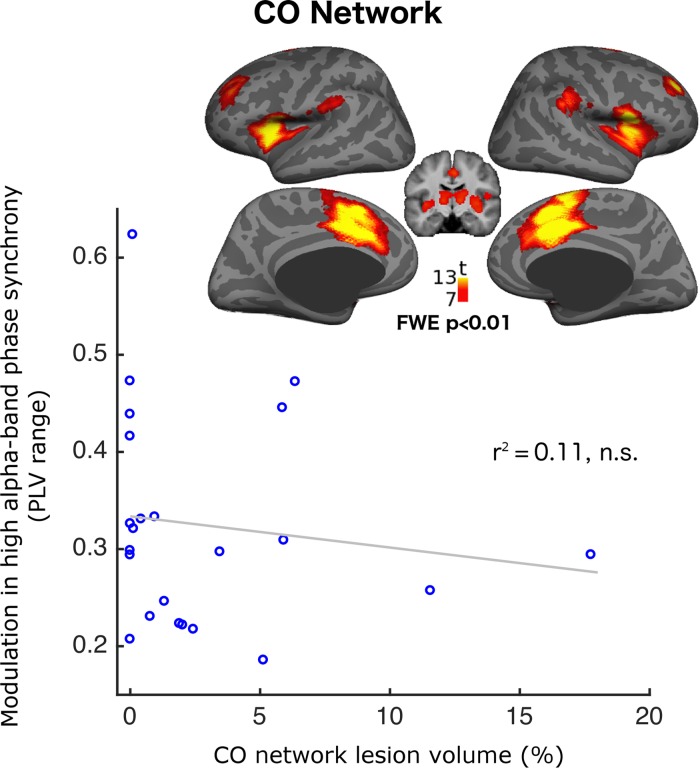
Figure 5.
Demonstrating absence of impact of cingulo-opercular (CO) network lesion on phase-synchrony modulation. The graph shows modulation of relative high-α phase synchrony as a function of CO network lesion volume. The brain map shows the CO network defined using resting-state fMRI in an independent pool of 26 healthy participants (Sadaghiani et al. 2010).

