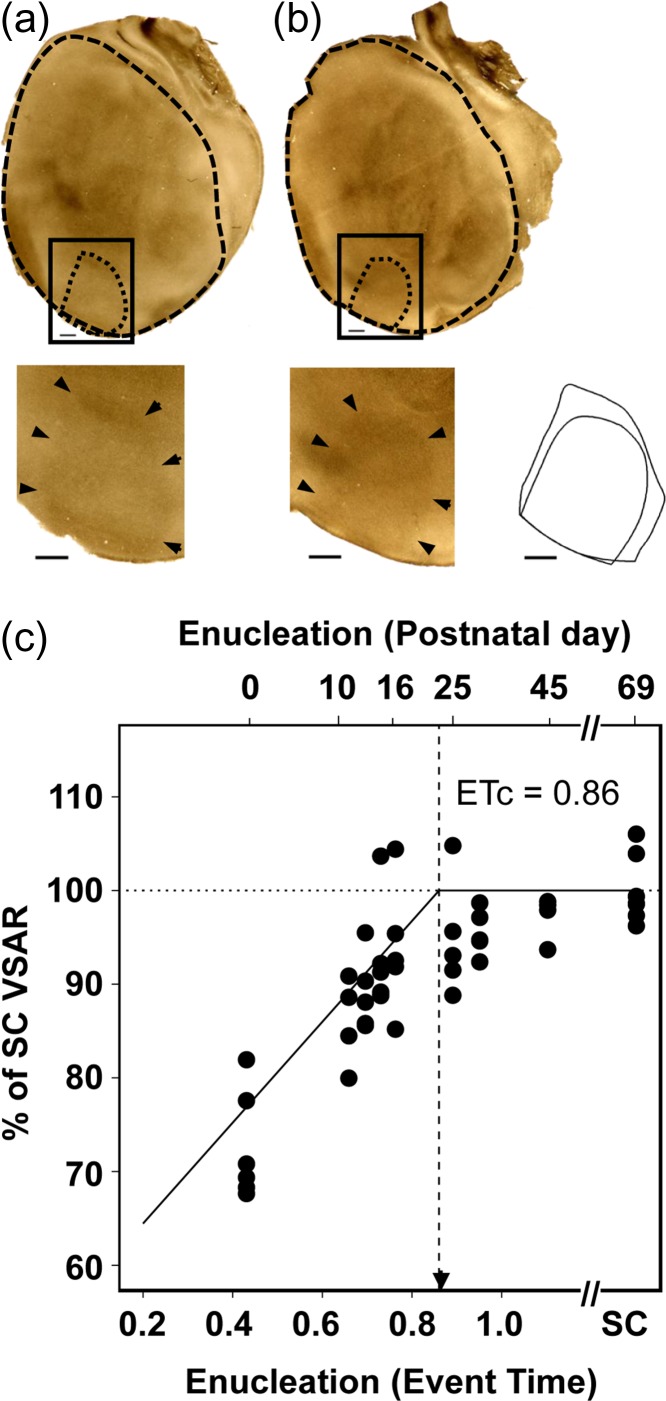
Figure 1.
Rat primary visual cortex surface area as a function of age of deprivation onset in bilaterally enucleated rats. Profiles of V1 and cortical mantle revealed in tangential sections for (a) SC rat measured at postnatal day (P) 60 rat and (b) a BEP12 rat. In both visual cortices, heavily-stained myelinated regions allow delineation of primary visual cortex (dashed black line). Inset shows the overlaid outlines of V1 surfaces of the P60 control and BEP12 rat, illustrating the reduced surface area of the BEP12 hemisphere compared with control. Scale bars = 1 mm. (c) Percent of adult sighted control VSAR, for rats enucleated over an age range extending from P0 (ET = 0.43) to P45 (ET > 1). A second abscissa indicates the postnatal day at which binocular enucleation was performed. The solid line indicates the piece-wise regression line of best fit (adjusted R2 = 0.69). Vertical dotted line indicates the estimated end of the effect of enucleation (ETc = 0.86). Arrowhead indicates V1 peak synaptic density. SC = sighted control, VSAR = Primary visual to non-visual cortex surface area ratio.

