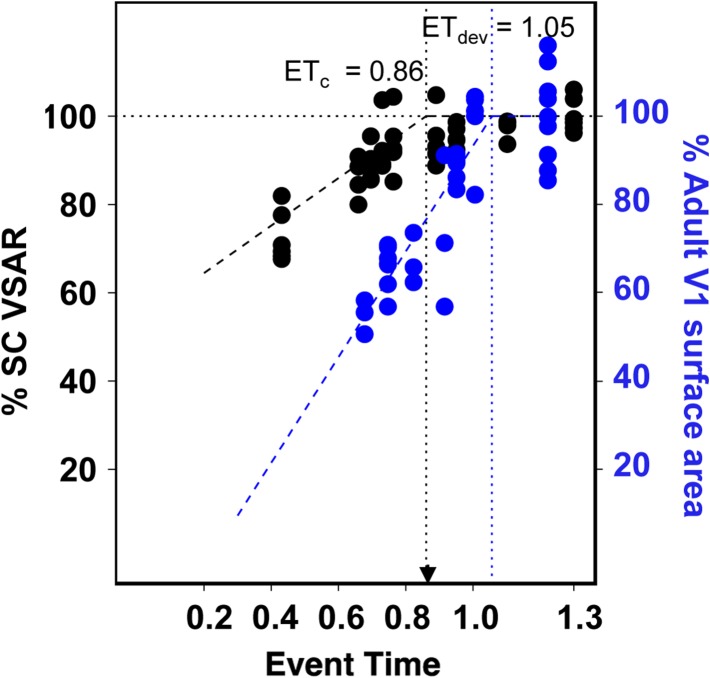
Figure 6.
Comparison of the effect of age of blindness onset on the area size of V1 with the normal development of V1 in sighted rats. Data from the enucleated rats in Fig. 1c (black circles) are plotted with data from normally developing rats (blue circles) sacrificed at ages P11, P15, P20, and P27 replotted from Duffy et al. (1998), and P30 and P35 collected in the present study. Because Duffy et al. (1998) did not report measurements for the non-visual isocortex, the surface area values for V1 were normalized by dividing them by the size of V1 measured in the respective adult sighted control rats and the ratio was expressed as % of adult size of V1 (blue Y-axis legend). Exact ages of the adult rats in Duffy et al. (1998) were not specified, but were set at P69 (ET > 1.2). ETdev is the estimated ET at which V1 surface area reaches adult size.

